
Key takeaways
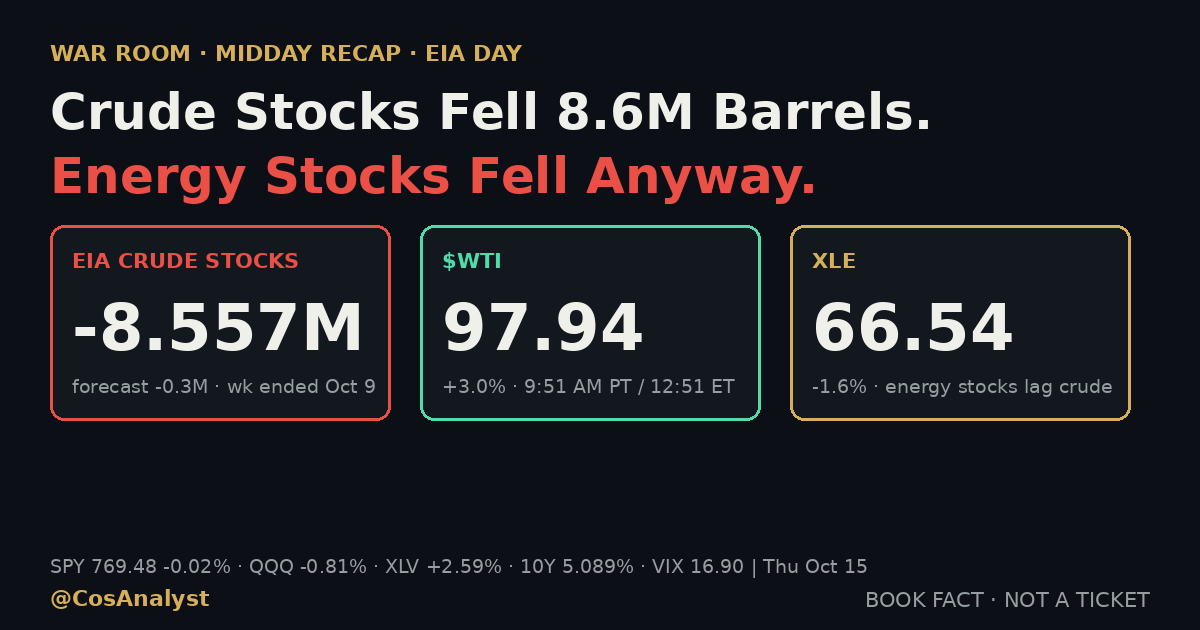
- EIA reported a crude inventory draw of 8.557 million barrels for the week ended Oct 9, against a forecast draw of 0.3 million. Commercial crude stocks fell to 415.577 million barrels, while gasoline stocks rose 3.518 million (EIA).
- $WTI is up about 3.0% at 97.94, within 0.4% of its 98.32 high, yet XLE is down 1.6% at 66.54. Energy stocks are lagging crude, a divergence (TradingView).
- This is sector rotation, not a crash. SPY is flat at 769.48 (-0.02%). XLV (+2.59%) and RSP (+0.95%) lead, while QQQ (-0.81%), SMH (-2.42%) and XLK (-1.48%) lag. VIX is 16.90 after an 18.01 spike.
- The 10-year Treasury yield is 5.089%, still 10.5 basis points below Wednesday's close, after September PPI rose 1.3% against a 0.5% forecast (BLS).
- October Fed hike odds are 27.5% on Polymarket, with no change at 71.5%. Fed Chair Kevin Warsh speaks tonight at 8:30 PM PT, and Friday is monthly options expiration with the market leaning negative gamma.
The midday surprise was not in stocks. It was in oil. The EIA said U.S. commercial crude inventories fell 8.557 million barrels last week, against a forecast draw of just 0.3 million, and $WTI is up about 3% near $98. Energy stocks did not follow. XLE is down 1.6%, even though crude is trading within half a percent of its high of the day.
Meanwhile the S&P 500 has barely moved. SPY is 769.48, down 0.02% from Wednesday's close of 769.60, after a morning low of 764.43. Thursday's hot September PPI did not break the market. Under the surface, money is rotating: health care (XLV +2.59%) and equal-weight stocks (RSP +0.95%) lead, while chips (SMH -2.42%) and tech (XLK -1.48%) drag the Nasdaq-100 (QQQ -0.81%).
EIA crude inventories: an 8.6 million barrel draw
The Energy Information Administration's Weekly Petroleum Status Report showed U.S. commercial crude oil inventories, excluding the Strategic Petroleum Reserve, fell 8.557 million barrels to 415.577 million barrels in the week ended Oct 9. The prior week's draw was 3.186 million barrels. The forecast on the TradingView economic calendar was a draw of only 0.3 million.
| Weekly change, week ended Oct 9 | Actual | Forecast | Prior week |
|---|---|---|---|
| Commercial crude oil | -8.557M | -0.3M | -3.186M |
| Gasoline | +3.518M | -0.5M | +0.382M |
| Distillate fuel oil | -2.527M | -1.6M | -0.042M |
Actuals and prior-week changes from the EIA Weekly Petroleum Status Report (barrels); forecasts from the TradingView economic calendar.
The draw was concentrated on the Gulf Coast (PADD 3), where crude stocks fell 9.239 million barrels. Stocks at the Cushing, Oklahoma hub rose 1.862 million barrels to 26.607 million. Crude imports averaged 6.049 million barrels per day, down 791,000 from the prior week, and the Strategic Petroleum Reserve was unchanged at 282.983 million barrels.
The product side was mixed. Gasoline stocks built 3.518 million barrels against an expected draw, and finished motor gasoline product supplied, a demand proxy, fell 362,000 barrels per day to 8.408 million. Total products supplied, however, rose 965,000 barrels per day to 21.361 million, led by distillate and propane. In our read, a large crude draw alongside a gasoline build is not a clean bullish signal, which is one reason the equity market may be reluctant to chase it.
$WTI jumps about 3%, toward $98
$WTI, the front-month crude future, trades at 97.94, up 2.85 or 3.0% from Wednesday's close near 95.09. The day's range is 93.58 to 98.32. TradingView's 15-minute bars show a grind, not a single spike: $WTI was near 94 at 3:00 AM ET, near 96 around the 9:30 AM ET stock open and near 98 by noon ET. It sits within 0.4% of the day's high after the inventory report.
This is the same commodity behind this morning's inflation data. The BLS said September final demand energy prices rose 10.8%, gasoline 20.3%, and crude petroleum in the intermediate-demand pipeline 28.3%. Our morning PPI note covers the full print: producer prices up 1.3% against a 0.5% forecast, core up 0.7%. A crude draw on top of that keeps the energy-inflation question open going into tonight's Fed speech.
XLE vs oil: why energy stocks are falling while crude rises
XLE, the Energy Select Sector SPDR, trades at 66.54, down 1.61% from Wednesday's close of 67.63. It opened at 67.90, which is still its high of the day.
The timing matters. TradingView's 15-minute bars show XLE had already slid to about 66.65 by 10:15 AM ET, roughly 1.5% below Wednesday's close, when $WTI was near 96.58. Since then $WTI has gained about 1.4% and XLE has slipped a further 0.2%. Energy stocks sold off before the EIA number and have ignored crude's climb after it.
Why would producers lag the commodity? We have three working explanations, and the data cannot yet separate them. First, equities price the longer-dated oil curve, and a one-week inventory draw barely moves it. Second, energy shares may be a funding source in a tape that is reshuffling toward health care and equal-weight names. Third, a sharp oil move in a week of hot producer prices can raise demand and policy risk, which equity investors discount. These are our read, not facts.
A one-day divergence like this usually closes one of two ways: the stocks catch up, or crude gives the move back. We do not know which, and we are not treating either as a signal.
Sector rotation: health care and equal weight lead, chips lag
| Midday, Thu Oct 15 | Last | Change vs Wed close |
|---|---|---|
| SPY | 769.48 | -0.02% |
| QQQ | 723.06 | -0.81% |
| IWM | 273.08 | +0.63% |
| RSP (equal weight) | 214.11 | +0.95% |
| XLV (health care) | 178.47 | +2.59% |
| XLK (technology) | 187.61 | -1.48% |
| SMH (semiconductors) | 551.10 | -2.42% |
| XLE (energy) | 66.54 | -1.61% |
| VIX | 16.90 | +0.18% |
TradingView marks at about 9:51 AM PT / 12:51 PM ET; changes are versus Wednesday's close.
Seven of the 11 sector SPDRs were green at about 9:49 AM PT. XLE, XLK and XLI were the decliners, and utilities were flat. Small caps (IWM +0.63%) are outperforming the Nasdaq-100, which is the rotation tell: value, breadth and defensives are bid while mega-cap growth and semiconductors are sold.
QQQ's day range of 715.44 to 726.10 equals about 1.46% of Wednesday's close, against about 0.88% for SPY (764.43 to 771.23). The Nasdaq-100 is still stretching more than the S&P. The S&P was down about 0.7% at its morning low and has since climbed back to flat. That differs from the premarket read in our morning PPI note, when SPY was indicated down 0.29% and QQQ down 1.18%: the dip was bought outside of chips.
VIX is 16.90 after a spike to 18.01 at the open, with a low of 16.62. That is well short of a panic reading.
The 10-year Treasury yield is still lower after PPI
The 10-year yield is 5.089%, down 10.5 basis points from Wednesday's 5.194% close, and the 2-year is 4.751%, down 5.5 basis points. The dollar index is 102.07, down 0.44%. The pattern is unchanged from this morning: a hot PPI print (1.3% against 0.5%, core 0.7% against 0.3%, 6.3% over 12 months, per the BLS) and falling long yields. The 10-year is about 2 basis points above our 5:49 AM PT reading of 5.066%, so the bond bid has eased slightly, but the day's range of 5.039% to 5.156% sits below Wednesday's level throughout. The overnight Asia backdrop is in our Seoul circuit breaker note.
Fed rate hike odds for October: Warsh speaks tonight
Polymarket prices a 25 basis point hike at the Oct 27-28 meeting at 27.5% as of about 9:51 AM PT, with no change at 71.5%. That compares with 30.5% at Wednesday's close and 25.5% in our 5:46 AM PT morning reading, so the crowd has barely moved through PPI and the crude report. December is a different story: a 25 basis point hike is 78.5%, with no change at 18.5%. The market says a hike is coming, just not necessarily in October.
Fed Chair Kevin Warsh speaks tonight at 8:30 PM PT (11:30 PM ET), after the cash close, and Fed's Hammack speaks at 1:30 PM PT. A $WTI price near $98 and producer prices at a 6.3% annual rate are the kind of inputs a hawkish speaker can cite. Patience language would fit the bond market's bid. For how we read the odds, see our October and December hike odds note, and for the first hot-data reaction, our Wednesday close recap.
Options expiration Friday: negative gamma and the call walls
Friday is monthly options expiration. Our desk's read of dealer positioning through Friday leans negative gamma in both SPY and QQQ, and in that regime hedging flows tend to amplify moves instead of damping them. If you want the mechanics, our explainers on positive versus negative gamma and gamma exposure lay it out.
The call walls, the strikes where call open interest is heaviest, sit at 785 in SPY and 760 in QQQ, well above midday levels of about 769 and 723 (CosAnalyst desk, delayed CBOE chain, read at about 5:17 AM PT before the open and not refreshed). Negative gamma plus Warsh tonight is why we respect the tails even on a quiet-looking tape.
What to watch today and tomorrow
- Thu Oct 15, 1:30 PM PT (4:30 PM ET): Fed's Hammack speaks.
- Thu Oct 15, 8:30 PM PT (11:30 PM ET): Fed Chair Warsh speaks.
- Fri Oct 16, 5:30 AM PT (8:30 AM ET): import prices (forecast +0.8%) and export prices (forecast +1.0%).
- Fri Oct 16, 6:15 AM PT (9:15 AM ET): industrial production (forecast +0.4%).
- Fri Oct 16: monthly options expiration.
- Oct 27-28: FOMC meeting.
Three ways the energy divergence can resolve
- $WTI holds near 98 and XLE catches up: the stocks were the laggard, and the crude move is believed.
- XLE keeps lagging while $WTI holds: equities are discounting the draw as a one-week story, and the Cushing and gasoline builds back that read.
- $WTI fades back toward 95: the draw was noise, and energy stocks were right to ignore it.
We do not know which of these wins. We know the question: does the equity market trust a one-week crude draw, and does the rotation hold into Warsh and Friday's expiration.
FAQ
What did the EIA crude inventory report show?
The EIA's Weekly Petroleum Status Report showed commercial crude stocks, excluding the Strategic Petroleum Reserve, fell 8.557 million barrels to 415.577 million in the week ended Oct 9, against a forecast draw of 0.3 million and a prior draw of 3.186 million. Gasoline stocks rose 3.518 million barrels and distillate stocks fell 2.527 million. Crude stocks at Cushing rose 1.862 million.
Why did energy stocks fall when oil jumped?
XLE is down 1.6% at 66.54 while $WTI is up about 3.0% at 97.94. XLE had already fallen about 1.5% by 10:15 AM ET, before the move in crude extended, and has not followed crude higher since. Our read is that equities price the longer-dated oil curve rather than one week of inventories, and that energy shares are being sold in a broader rotation. It is a read, not a certainty.
Is the stock market falling after the hot PPI?
Not broadly. At midday SPY is flat at 769.48 (-0.02%) and IWM is up 0.63%. Health care (XLV +2.59%) and equal weight (RSP +0.95%) lead, while semiconductors (SMH -2.42%) and the Nasdaq-100 (QQQ -0.81%) lag. VIX is 16.90 after an 18.01 spike. September PPI rose 1.3% against a 0.5% forecast, and the 10-year yield is still lower at 5.089%.
What are the Fed hike odds for October, and when does Warsh speak tonight?
Polymarket priced a 25 basis point hike at the October 27-28 meeting at 27.5% at about 9:51 AM PT, with no change at 71.5% and a December hike at 78.5%. Fed Chair Kevin Warsh speaks tonight at 8:30 PM PT (11:30 PM ET). Friday Oct 16 is monthly options expiration.
Follow the desk
Follow @CosAnalyst on X for the read on Warsh and Friday's expiration as they land. Join the free Telegram alerts channel, Free Index & BTC Trade Alerts. It has had 0 verified fires so far Thursday and on Oct 14, and sitting out when the setup is not there is part of the plan. Nothing there is financial advice.
BOOK FACT · NOT A TICKET. CosAnalyst research and analysis, not financial advice or a trade recommendation. Crude, gasoline and distillate inventories, Cushing and Gulf Coast stocks, imports and product supplied are from the U.S. Energy Information Administration Weekly Petroleum Status Report for the week ended Oct 9, 2026. Producer price figures are from the Bureau of Labor Statistics Producer Price Index news release for September 2026 (8:30 AM ET, Oct 15). Forecasts and the economic calendar are from TradingView. Quotes, sector ETFs, $WTI, yields, the dollar index and VIX are TradingView marks at about 9:51 AM PT / 12:51 PM ET, Thu Oct 15, 2026, with 15-minute bars used for the timing of the XLE and $WTI moves. Wednesday closes are TradingView daily closes. Fed odds are from Polymarket as of about 9:51 AM PT. FOMC dates are from federalreserve.gov. Call walls and the negative gamma read are from the CosAnalyst desk using a delayed CBOE chain and are not independently verified. Prediction-market odds and market data change quickly.