
Options · evergreen
What Is Gamma Exposure? The Dealer Hedge Behind the Tape
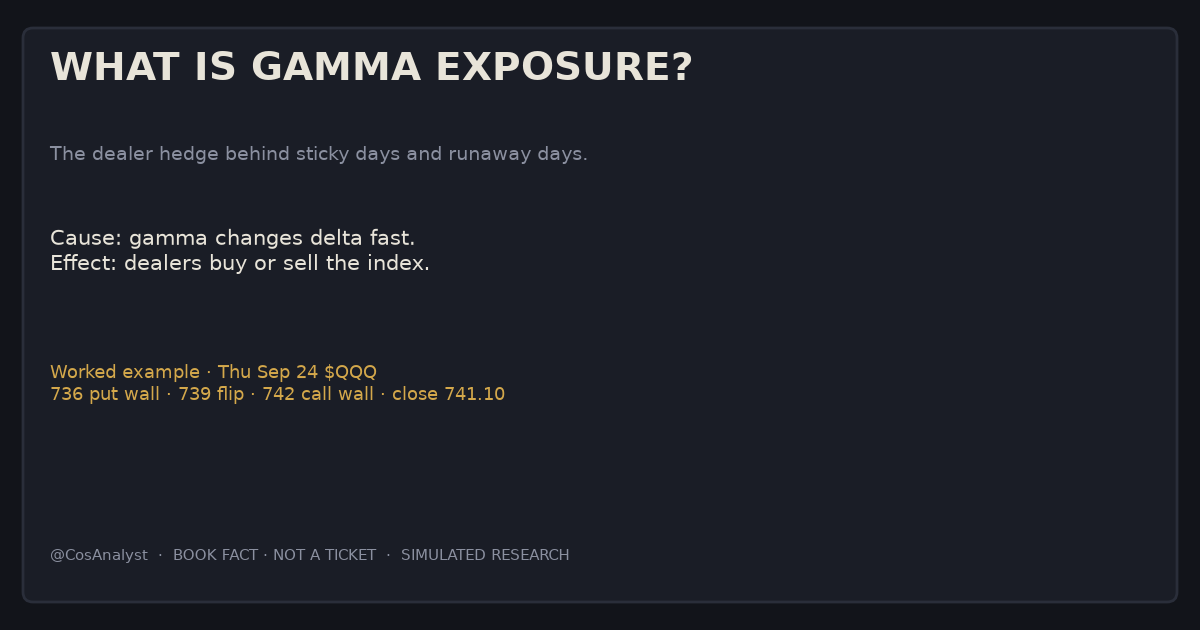
Gamma exposure maps how options dealers may buy or sell as price moves. Why some days stick, why some runaway, and Thursday's $QQQ classroom on the Cos map.
As of Fri Sep 25, 2026, 1:10 AM PT. Worked example uses Thu Sep 24 US cash. BOOK FACT · NOT A TICKET · SIMULATED RESEARCH
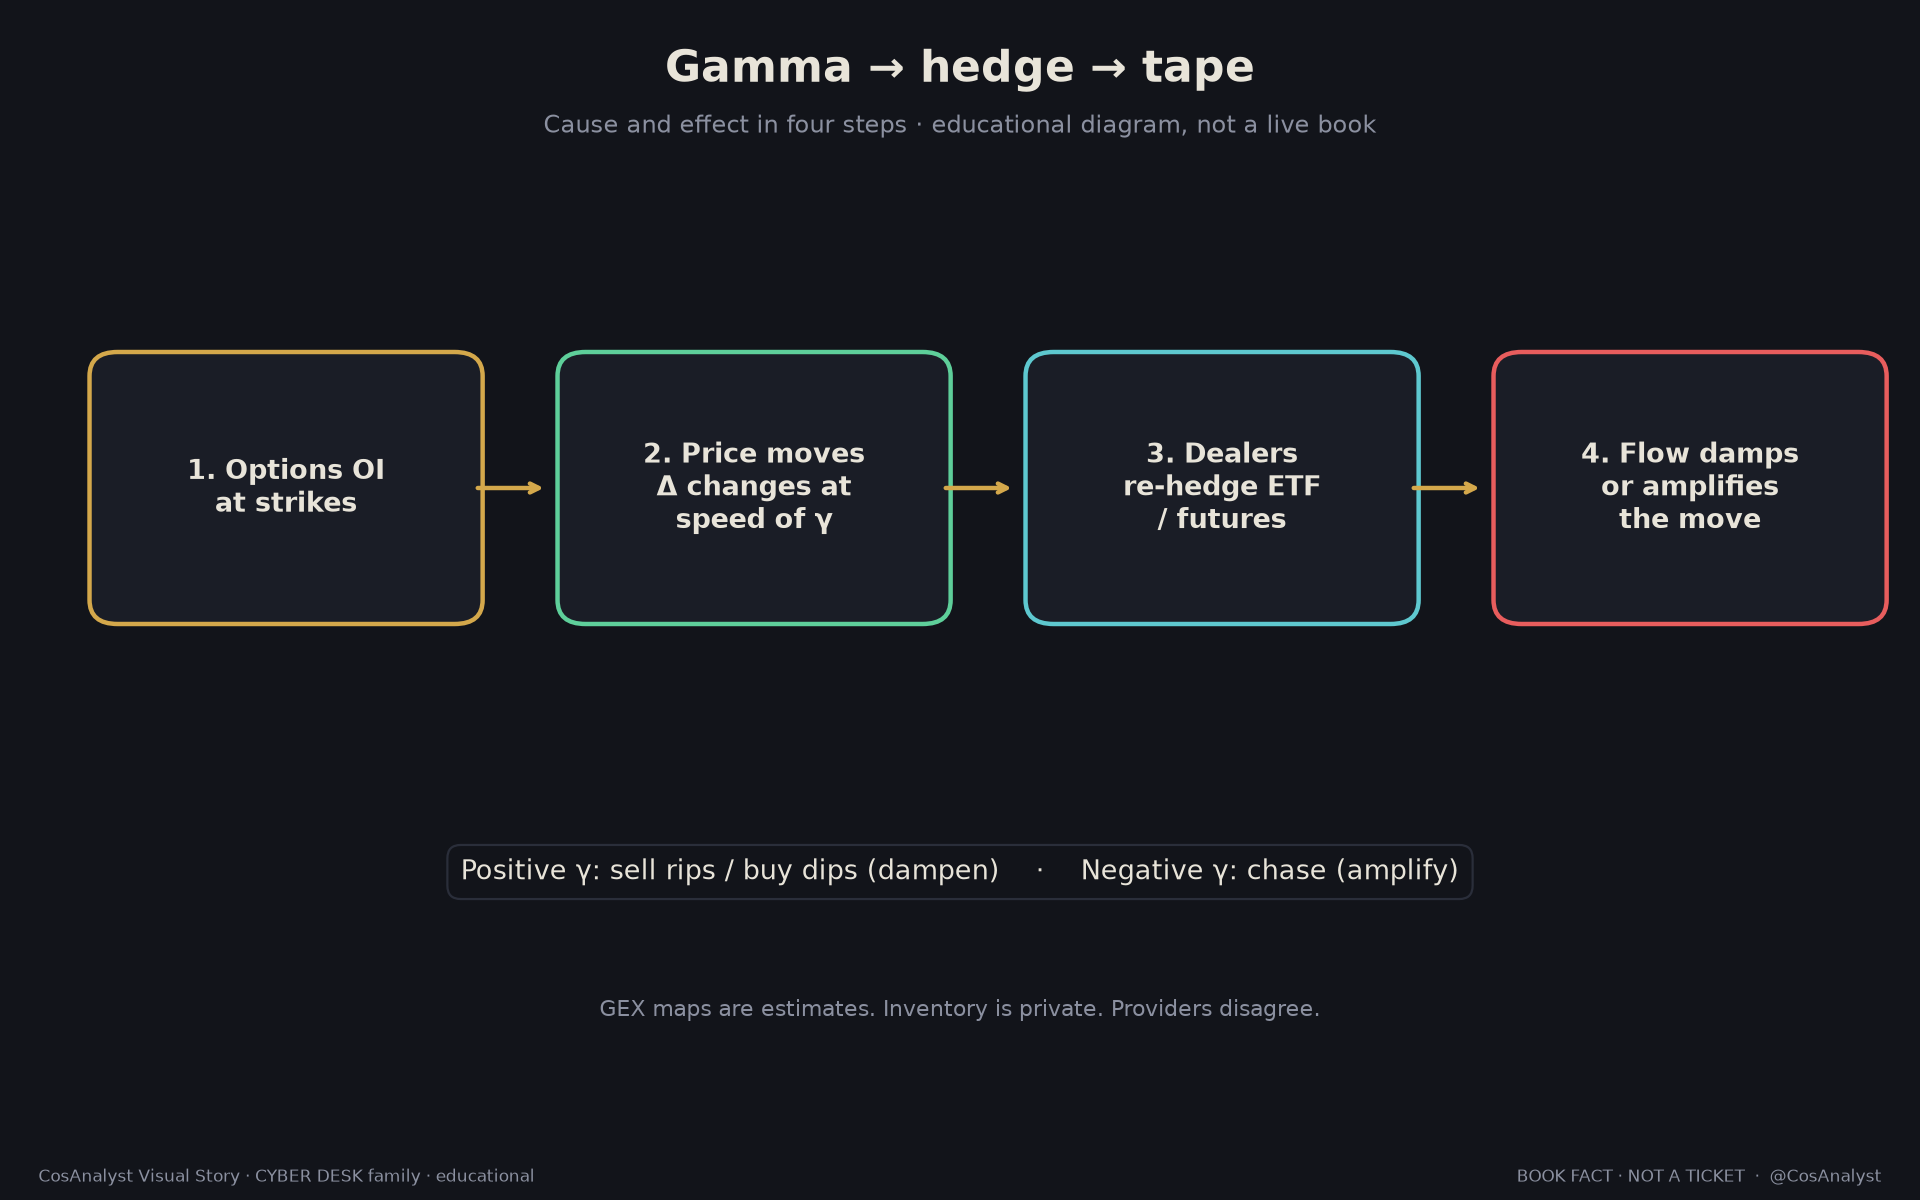
Gamma exposure (GEX) is an estimate of how options dealers may have to buy or sell the underlying as price moves. Gamma is how fast an option's delta changes, and delta is how much the option moves with the stock. When dealers resize those hedges, the flow can dampen or amplify the tape. The map describes a volatility regime, not a forecast of direction.
Thursday Nasdaq opened under a wall. By the close the same wall had been climbed, the flip recaptured, the call wall tagged.
If you only watched the candles, it looked like a mood swing. If you watched gamma, it looked like a book getting repaired.
What is gamma exposure in options?
Start with the chain, not the color chart.
An option's delta is its first sensitivity to the stock. Gamma is the speed of that change. A hedge that was right a minute ago can be the wrong size after the next tick.
Dealers, the firms on the other side of a lot of listed options, do not want a leftover bet on direction. They hedge in the underlying. When gamma is large, they have to hedge more often. That hedge is buying or selling QQQ, SPY, or the futures. That flow is the effect you can actually see.
Gamma exposure adds those gammas up across strikes and expirations, with a sign that tries to say whether dealers are long gamma or short gamma at this price. Shops build the map from listed open interest and an assumption about who is holding what. Dealers' true inventory is not public. Providers disagree. Cos stamps an estimate with a time and treats it as a map.
On Thursday's Cos map, read at 11:14 PT, QQQ net GEX was about -$331 million, with a Negative Gamma profile. That does not mean the Nasdaq must fall. It means the estimated book, at that hour, was in the amplifying regime. Price still closed higher. Regime is not direction.
How does dealer hedging work?
Two signs. One mechanism.
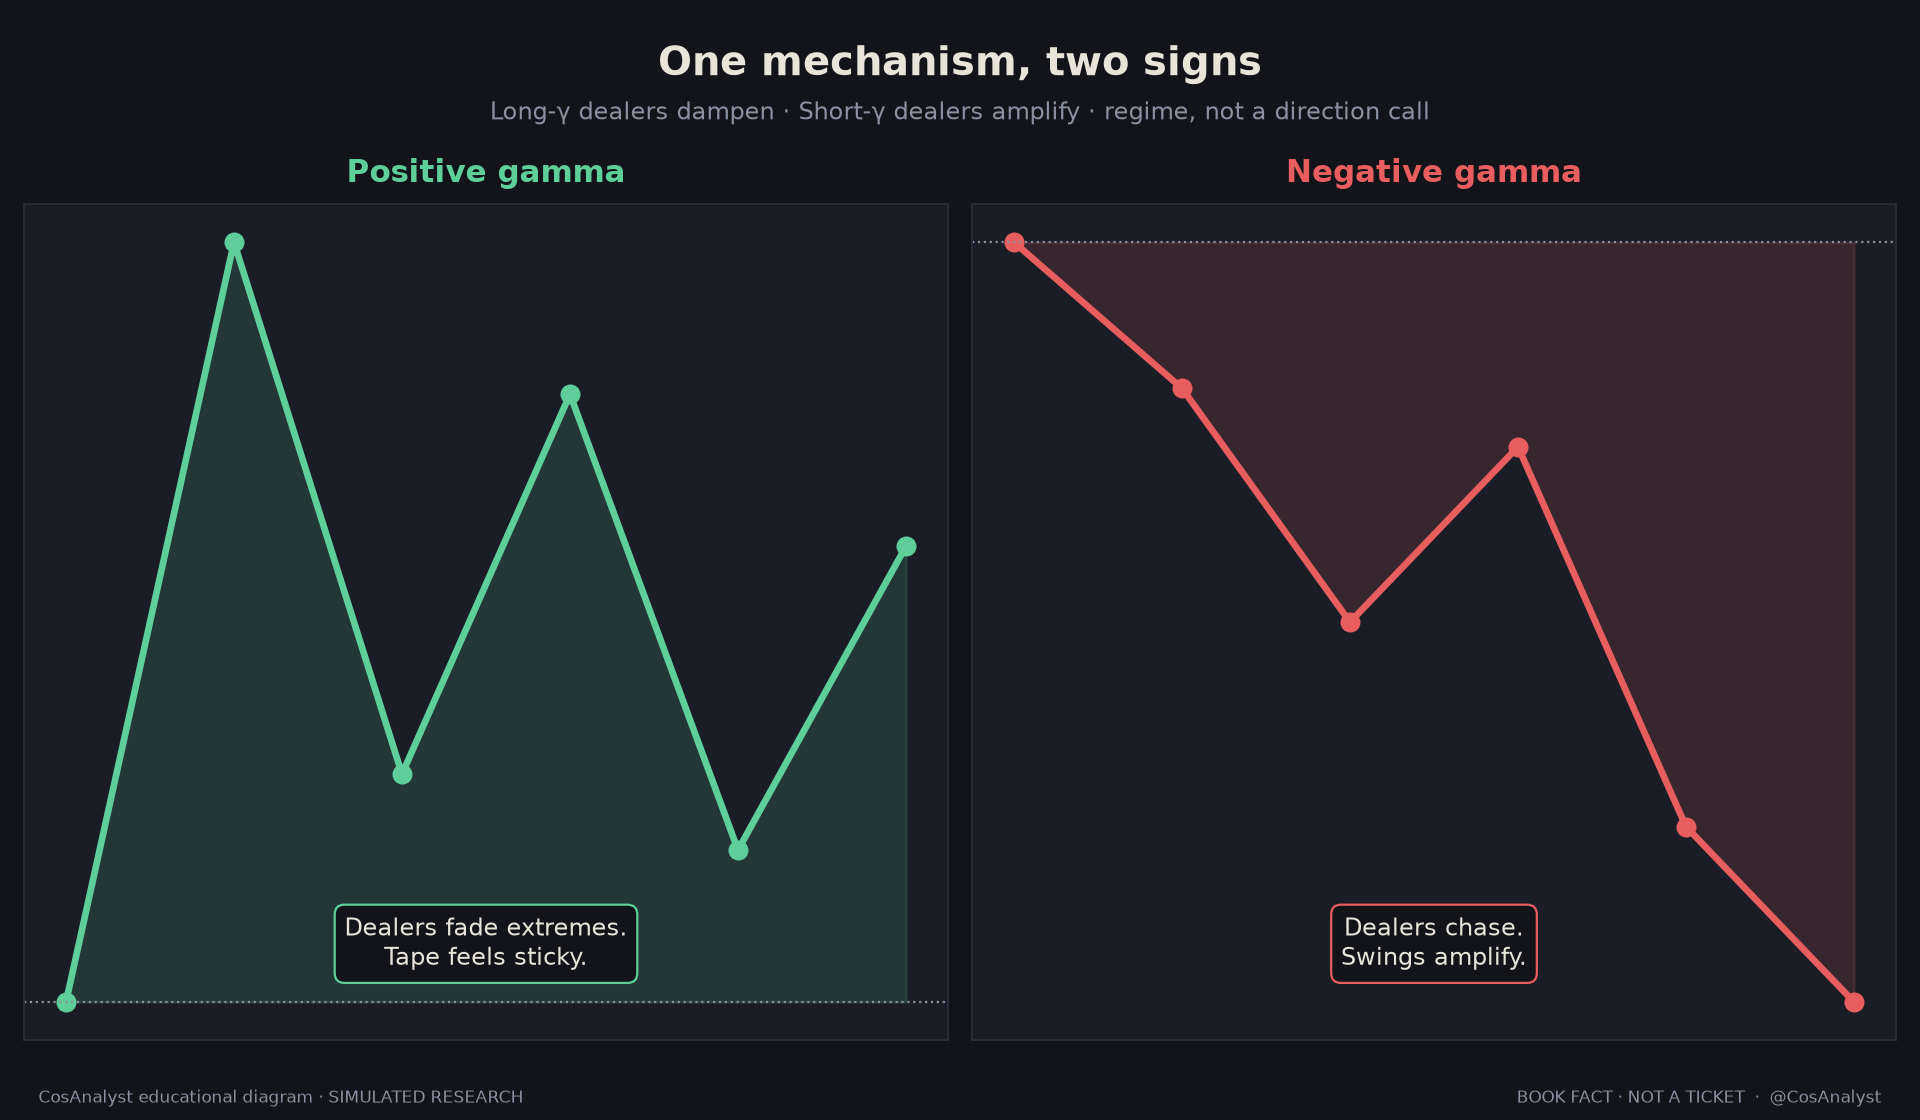
When dealers are long gamma (positive gamma exposure), they tend to sell into rips and buy into dips. Their hedge leans against the move. Realized swings often get smaller. The tape can feel sticky, almost bored.
When dealers are short gamma (negative gamma exposure), they tend to chase. Price drops, they sell more. Price rips, they buy more. Swings can get larger than the news seems to justify.
That is why GEX maps volatility character, not destination. Positive gamma is a dampener. Negative gamma is an amplifier. Neither one is a ticket.
Three landmarks show up on a Cos map:
- Put wall (P1): a strike with a large pile of put gamma. Below it, short-gamma hedging can speed both directions.
- Call wall (C1): the same idea on the call side. Rallies often slow near a heavy call cluster because the hedge starts selling into strength.
- HVL / flip: Cos's name for the estimated zero-crossing, where dealer gamma is modeled to change sign. Above it, dampening is more likely. Below it, amplification is more likely. The level moves as price, time, and open interest move.
What does a negative gamma day look like?
Thursday, September 24, 2026. QQQ cash, from TradingView: open 735.29, high 742.66, low 734.62, close 741.10.
The Cos map at 11:14 PT had three usable marks: put wall 736, HVL flip 739, call wall 742. Midday profile: Negative Gamma. Net GEX estimate: about -$331 million.
Watch the path, not the headline.
QQQ opened under the 736 put wall and printed 734.62. That is the cracked-book look. In a short-gamma regime, a break under a put wall is where dealer hedges can push the same direction as the tape.
The wall got reclaimed. Cash then crossed the 739 flip. The high 742.66 tagged toward C1 742. The close 741.10 sat above HVL 739 and under C1 742.
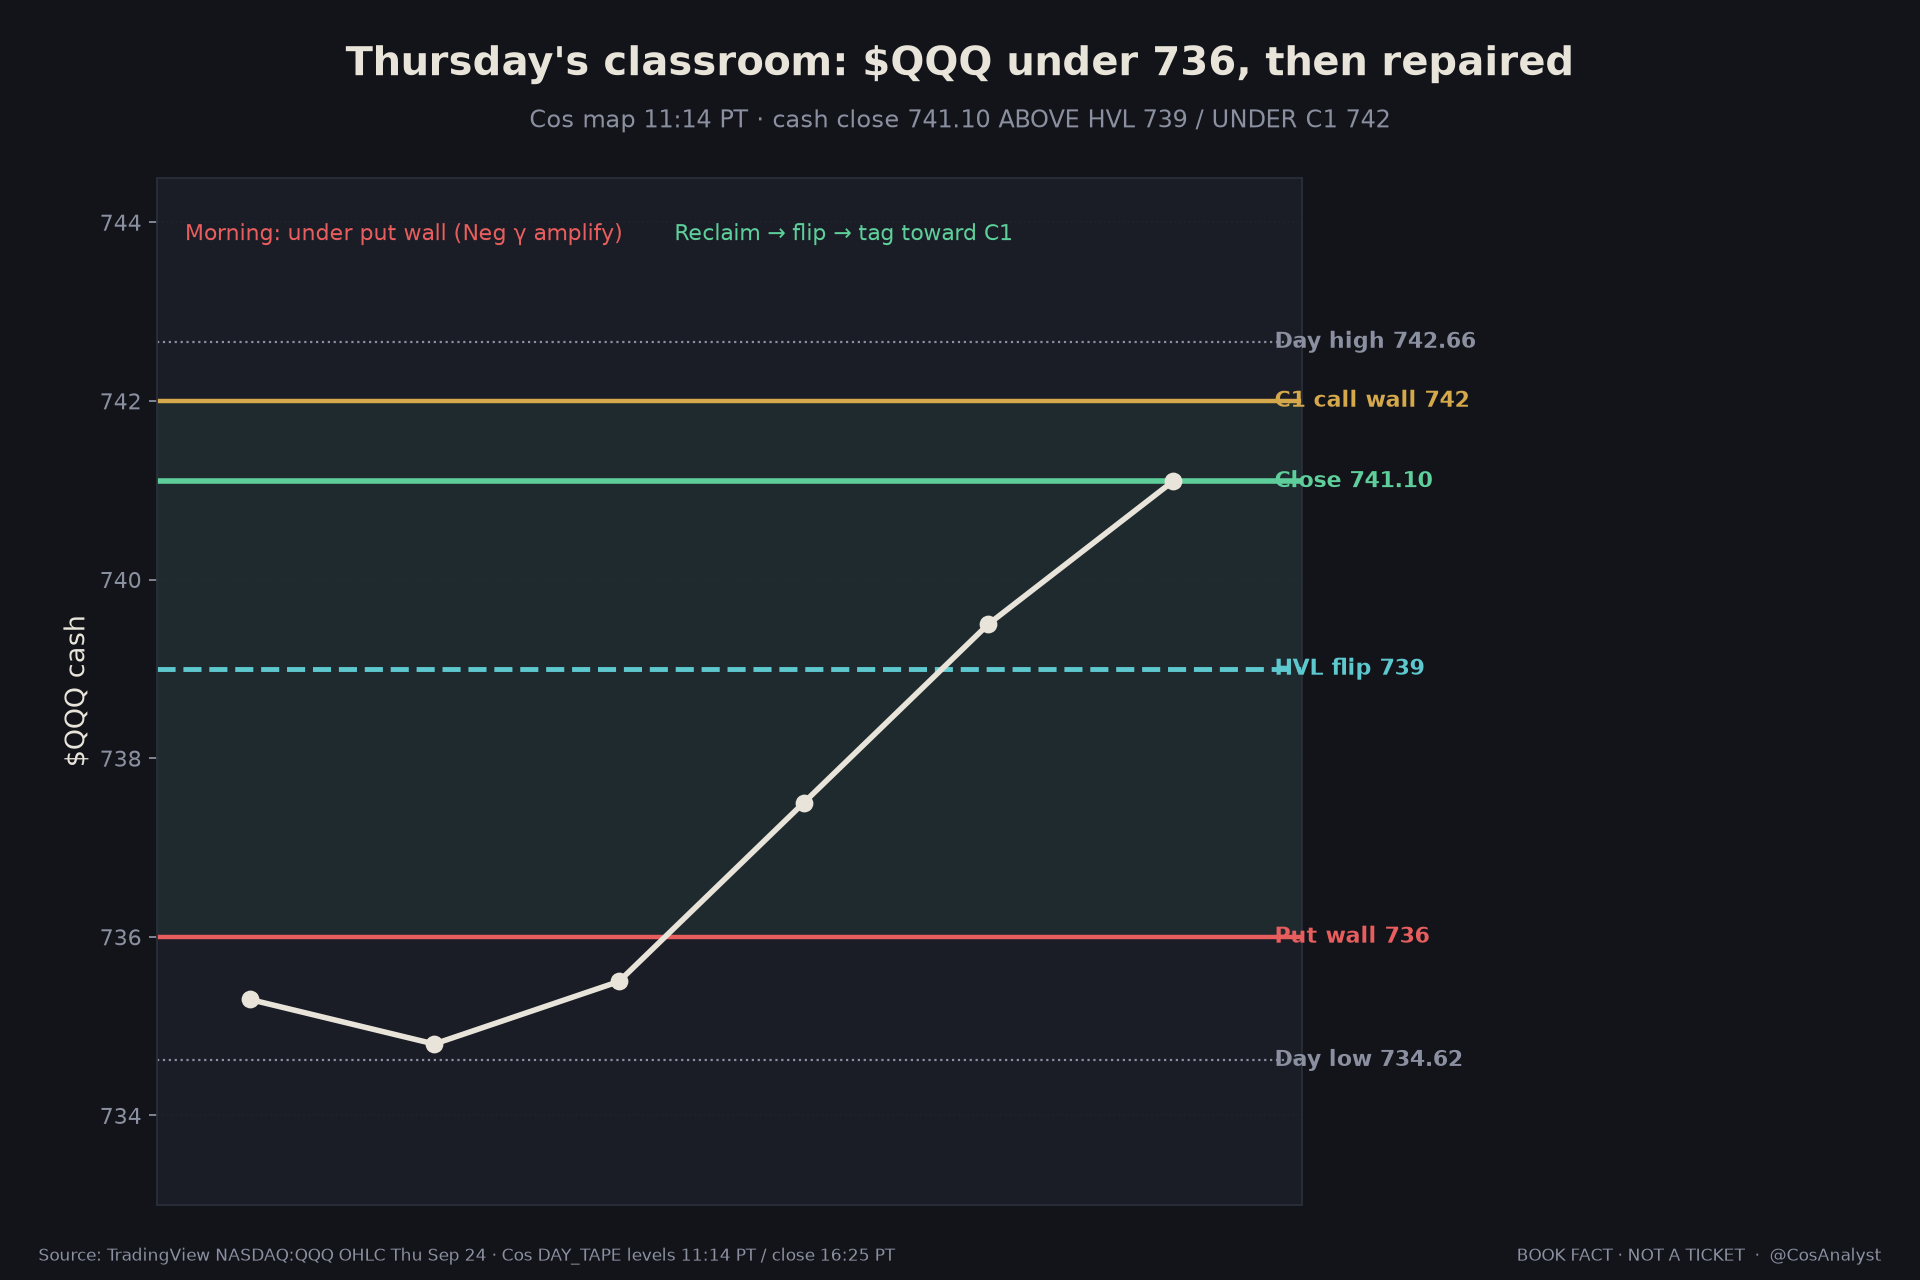
Negative gamma did not call a down day. It described the morning's extra slack, then the repair.
SPY closed 767.18, sitting on its own Cos flip at 767, with P1 765 and C1 768. VIX closed about 15.67. Rates had been loud earlier in the week. Stock vol was still napping. A calm VIX and a messy open can live in the same day when the options book is doing part of the work.
Two ways the next session can use this map
These are regimes, not predictions.
A. Price holds above the flip in a repaired map. QQQ stays above 739 and the 736 put wall stays recaptured. Dealer hedges are more likely to dampen. Moves can still happen. They often look smaller than the headline. Think sticky tape, not a mandate to chase.
B. Price loses the put wall again while the book is still short gamma. A break back under 736 in a Negative Gamma profile is the amplifier setup. Dealers chasing a down-move, or a rip, can make the range feel too big for the news. Same map. Opposite character.
Neither path is a buy or a sell. Both are how you read the same three numbers without turning them into a crystal ball.
Levels from Thursday's map
Stamped 11:14 PT Thursday. Cash close after 1:00 PM PT. Interim until the next Cos stamp.
QQQ
- Above 742 (C1): cash finished the repair and is testing the call wall. Dampening near a heavy call cluster is the usual mechanical story, not a promise.
- Between 739 and 742: the corridor Thursday actually lived in after the reclaim. Flip held. Call wall not accepted on the close.
- Below 736 (P1): the put wall is lost again. In a still-negative book, swings can stretch.
SPY (same session): P1 765 / HVL 767 / C1 768. Close 767.18 was the flip, almost to the penny.
What should you watch next?
- Does QQQ keep 739? Holding Thursday's flip keeps the repaired read. Losing it puts 736 back in play.
- Does 736 fail again? Second breaks of a put wall, while net GEX is still estimated negative, are when the amplifier tends to show up.
- A new Cos stamp. Open interest and same-day options flow rewrite the map. Thursday's 11:14 PT read is not the next session's book.
- The Fed calendar, not a GEX forecast. Next FOMC meetings are October 27-28 and December 8-9, 2026. Event days can flip a gamma regime because new options print and implied vol jumps.
- VIX versus the tape. Thursday's VIX near 15.67 was calm. If stock vol stays sleepy while the book is short gamma, do not confuse quiet with nothing to hedge.
This is the first Cos gamma explainer. Next in the series (still being written): positive vs negative gamma, the gamma flip, call walls and put walls, and dealer hedging. Four slices of the same mechanism.
FAQ
What is gamma exposure in options?
An estimate of how dealers' options books may force them to buy or sell the underlying as price moves. Gamma is the speed of delta. The hedge is the flow.
How is gamma exposure calculated?
From listed open interest, each option's gamma, and a model of who is long or short. Inventory is not public. Cos publishes a timestamped estimate. Other providers will not match it.
What does GEX mean in trading?
GEX stands for gamma exposure. It is a regime map: dampening when the estimated dealer book is long gamma, amplifying when it is short. It is not a directional signal.
Is SPX GEX predictive?
No. It maps how hedging flow may behave if price gets there. It does not forecast the close. SPX (cash-settled index) and SPY (ETF) are related books, not the same book. Thursday Cos showed both: QQQ 736 / 739 / 742, SPY 765 / 767 / 768.
The map is not the weather
People treat a GEX chart like a forecast because it has a number and a color. The number is an estimate of a hedge that has not happened yet. The color is a regime. Thursday opened under 736 in Negative Gamma and still closed 741.10, above the flip, under the call wall. The map did not fail. The people who asked it for direction did.
Gamma is the cause: delta changing fast. Dealer re-hedging is the effect: flow in QQQ and SPY. Read it that way and the walls stop looking like magic. They look like crowded strikes with a mechanical job.
Full research archive: https://cosanalyst.com/articles/what-is-gamma-exposure/
BOOK FACT · NOT A TICKET
SIMULATED RESEARCH
Not financial advice. GEX is an estimate. Dealers' true inventory is not public. Levels are a map, not a ticket.