
Research · research feature
The Fed hiked. The odds say October and December aren't done.
Last week's quarter-point move was supposed to clear the air. The rates market is pricing more hikes into year-end while stocks still trade like the Fed is finished.
The hike that was supposed to settle it
Last week the Fed moved. This week the argument started.
The September 16 quarter-point hike was supposed to clear the air into year-end. Plenty of stock traders still read it that way: one adjustment, then a long pause.
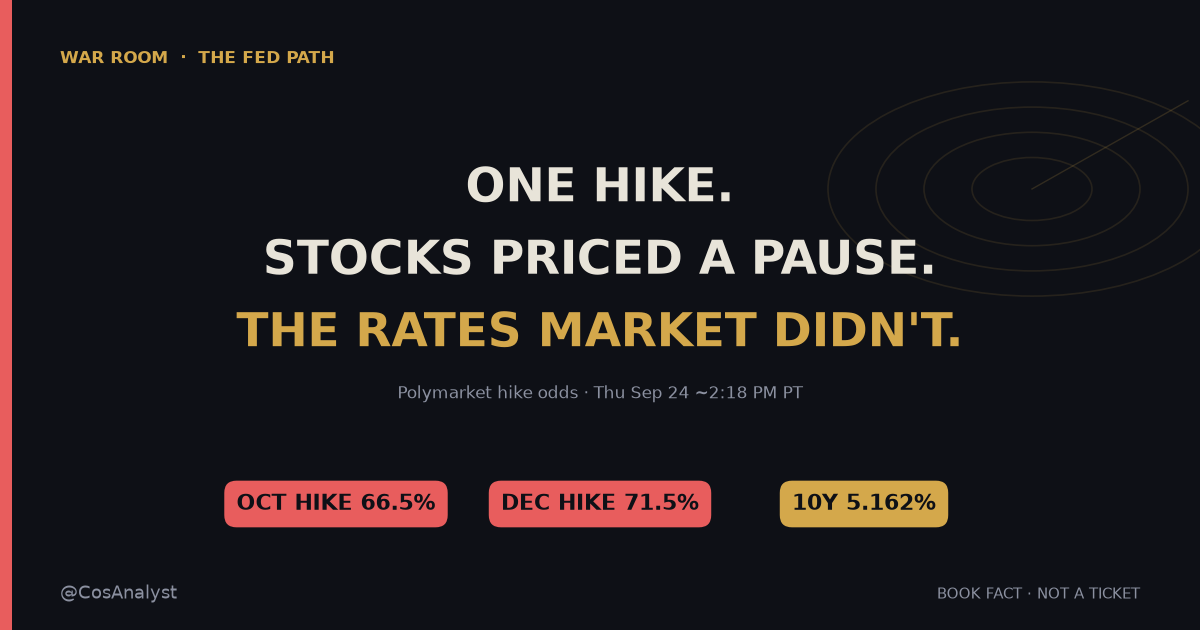
The rates market disagrees. As of Thursday afternoon, after the close, prediction markets put a 66.5% chance on another +25 bp hike at the October 28 meeting and 71.5% on a hike at the December 9 meeting. Both are above a coin flip. Stocks and bonds are pricing two different Fed paths, and one of them is wrong into the turn of the year.
What is happening
On September 16, the FOMC raised the federal funds target range by 25 bp to 3.75%-4.00%. The vote was 12-0. The statement was short. Activity is solid, inflation remains elevated, and "the Committee will deliver price stability."
The projections said more than the statement. The median projected funds rate for end-2026 rose to 4.1%, up from 3.8% in June. End-2027 is also 4.1%. On the 2026 dot plot, 12 of 18 officials sit at 4.125%, four at 4.375%, and only two at 3.875%. Put simply, the middle of the Committee already expects at least one more quarter-point this year.
A day before the bond selloff turned violent, Governor Michael Barr said it out loud. Speaking at a Chicago Fed housing summit on September 23, he listed tariffs, the Middle East conflict, Ukraine and the AI investment boom as sources of "upward price pressures." He said the Fed "were out of position, and we made an adjustment in the right direction." Then came the line that matters: "In my base case, further policy adjustments are likely to be needed."
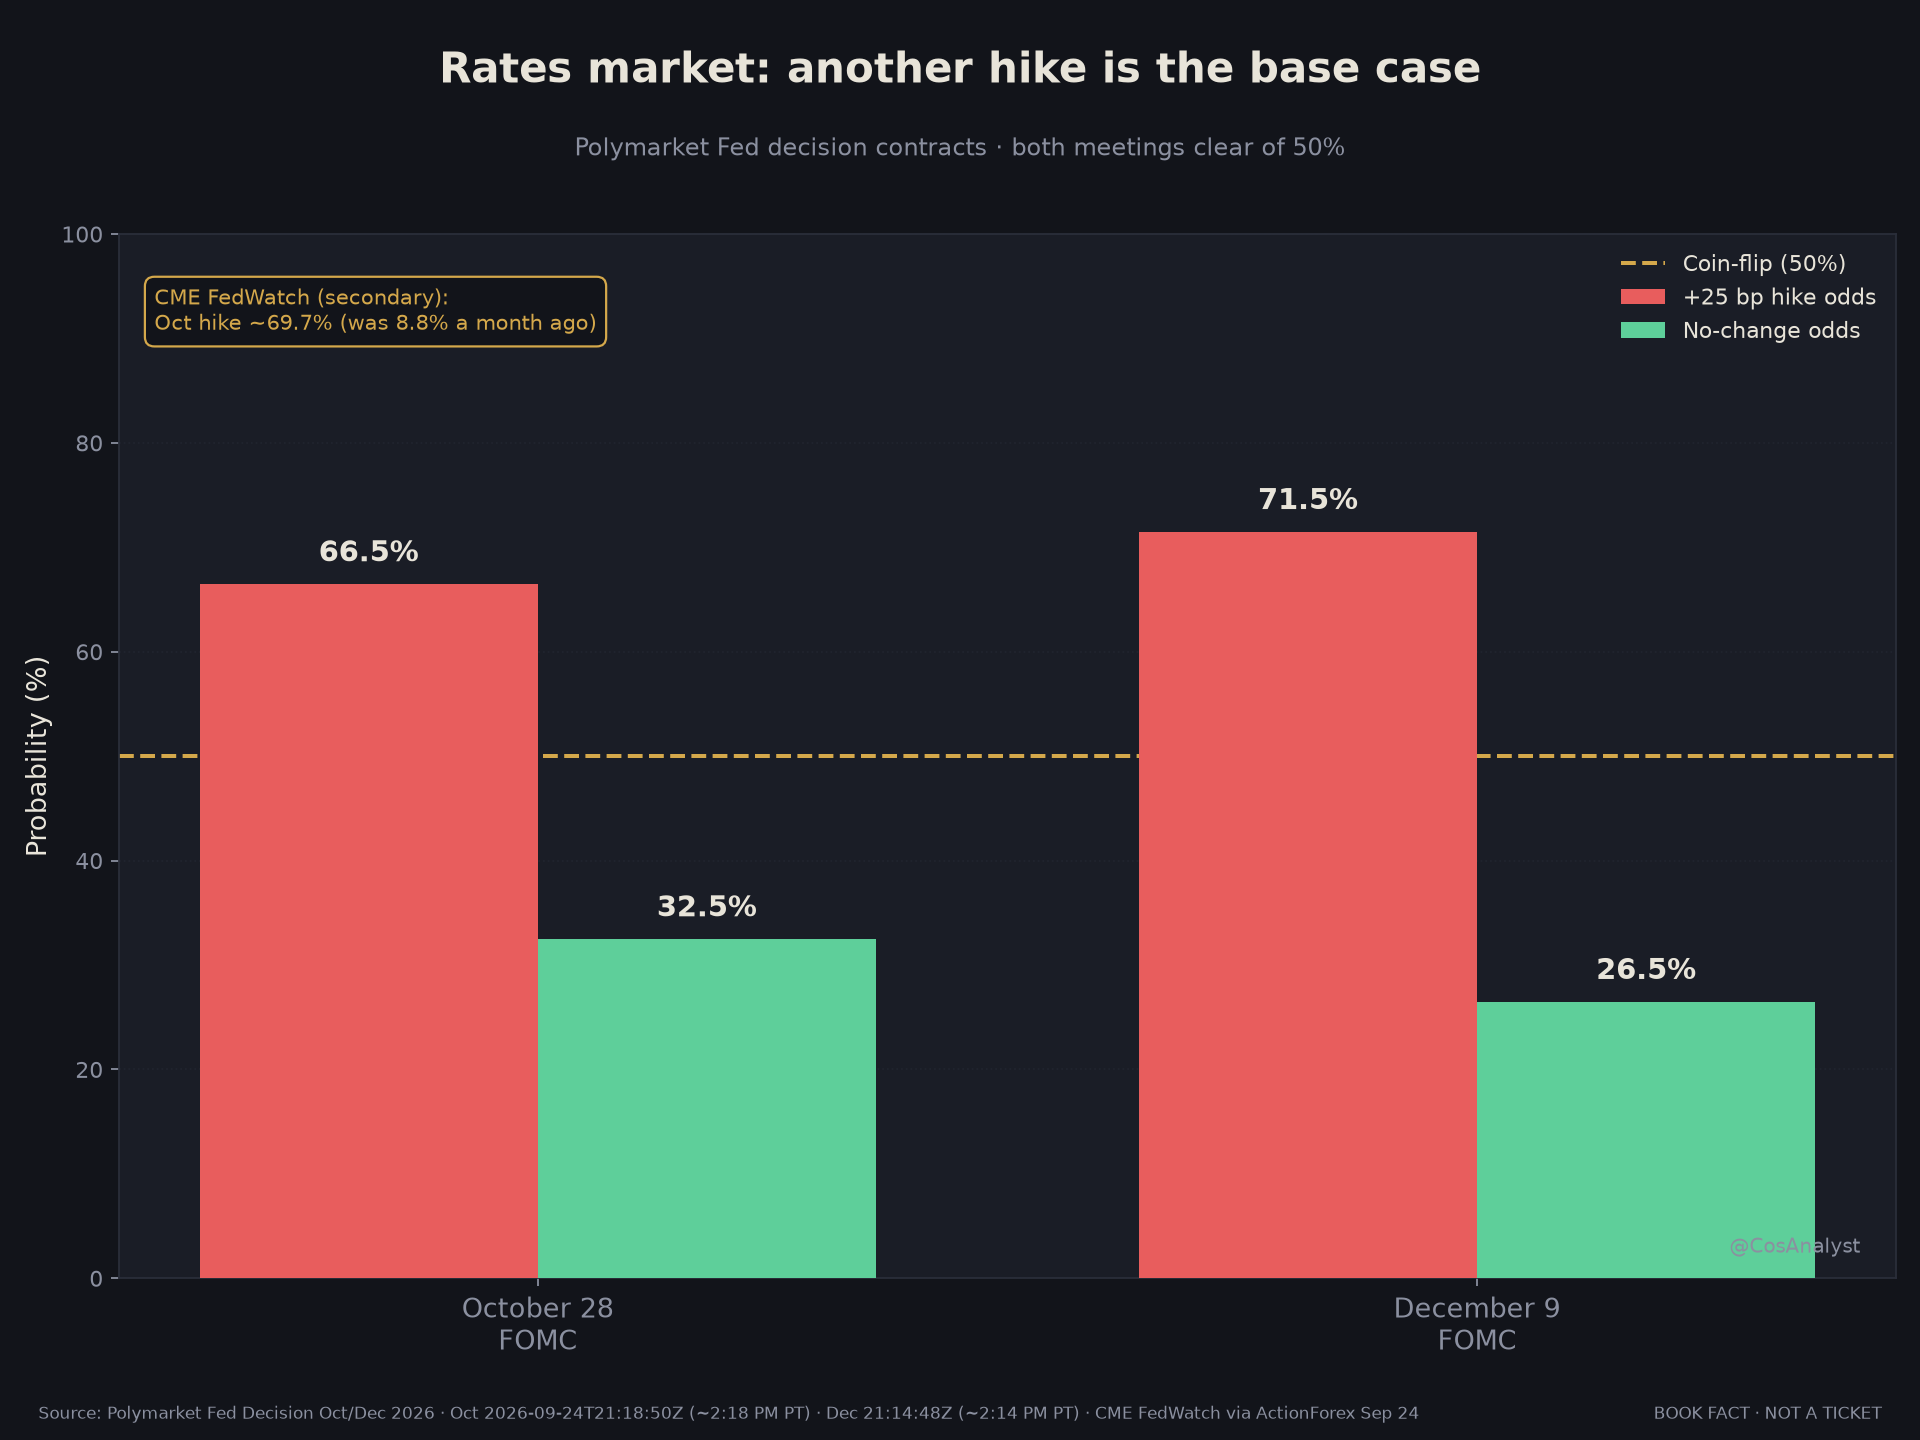
The hike did not cool expectations. CME FedWatch had October hike odds near 69.7% Thursday morning, up from 48.7% a week earlier and 8.8% a month earlier, as reported by ActionForex. Our own read of Polymarket after Thursday's close shows October +25 bp at 66.5% with no change at 32.5%, and December +25 bp at 71.5% with no change at 26.5%. A separate contract asking whether the Fed hikes again at any point in 2026 trades at 91.5% yes.
Wednesday's peak October reading was higher, near 73%. It has come in a little since. The conclusion has not changed. October and December are both above 50%.
The bond market already voted
The 10-year Treasury yield closed at 5.114%, up about 15 basis points in one day from 4.96% on Tuesday. That was the biggest one-day jump since the April 2025 tariff shock. On Thursday it rose again and closed at 5.162%.
The 30-year closed Thursday at 5.461%. The last time the Fed's official daily series closed at or above 5.44% was June 2004.
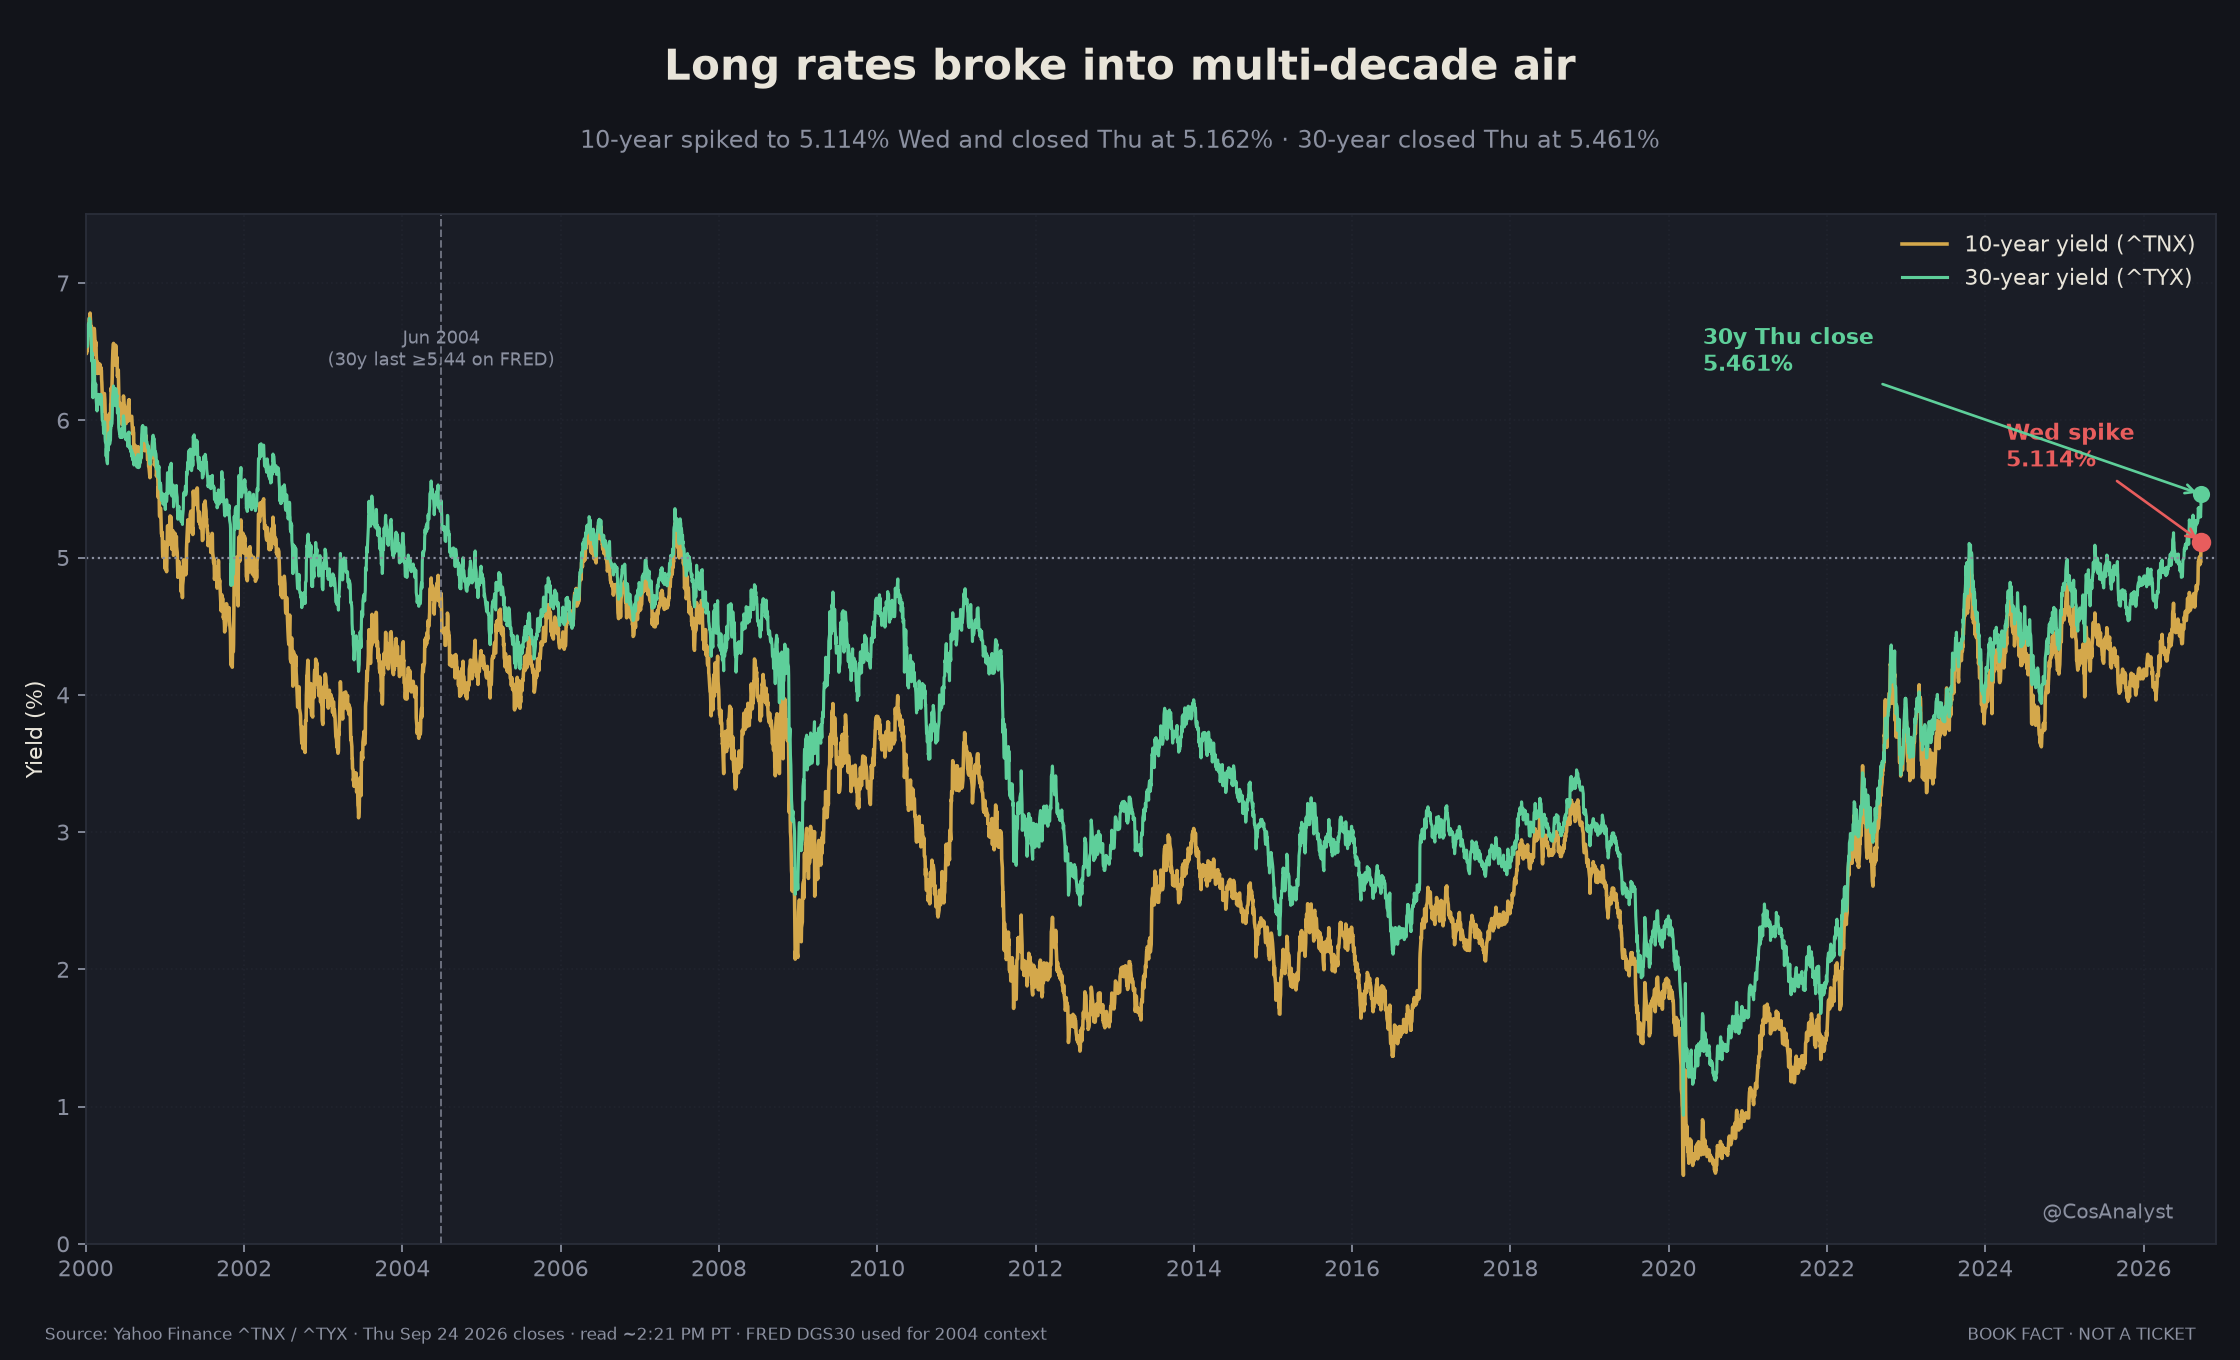
Mortgage rates, corporate borrowing and the discount rate behind every stock valuation all key off the long end. Barr's own speech cited homeownership affordability at a 21-year low in July.
Why it matters: the fear gap
Here is the part that should make you sit up. Bonds are pricing a storm. Stocks are pricing a nap.
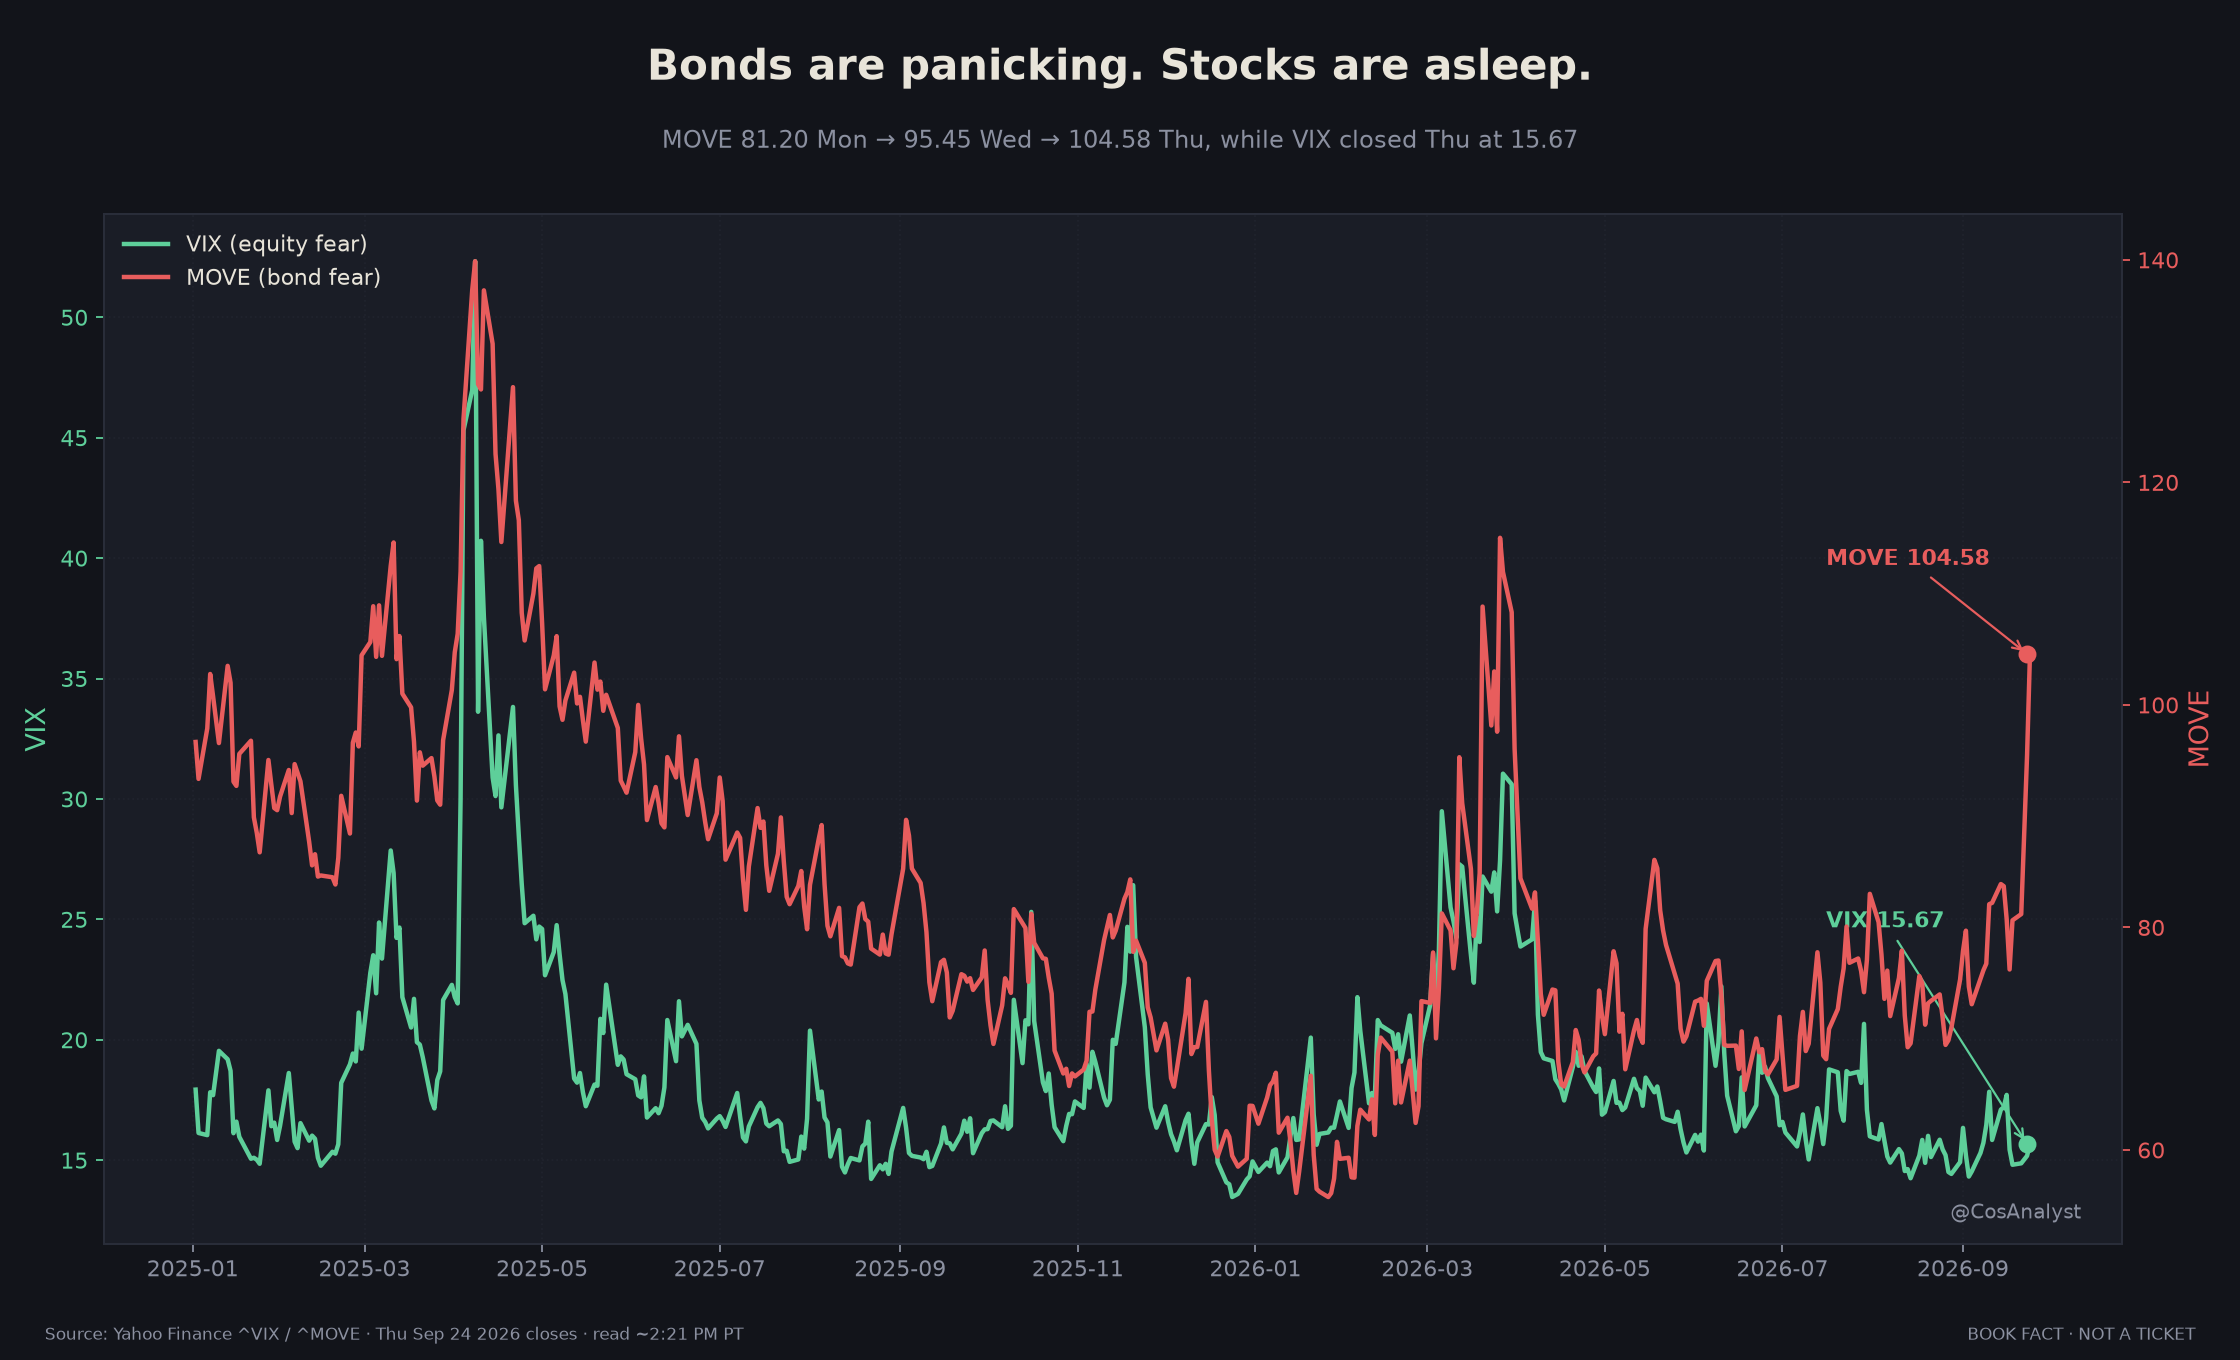
The MOVE index, which measures expected swings in Treasury prices, jumped from 81.20 on Monday to 95.45 Wednesday and 104.58 Thursday. The VIX, the same idea for the S&P 500, closed Wednesday at 15.18 and Thursday at 15.67. That is a very calm reading for the stock market during the biggest rates shock in more than a year.
Either bond traders are overreacting to one hot week, or stock traders are underpricing a Fed that keeps going.
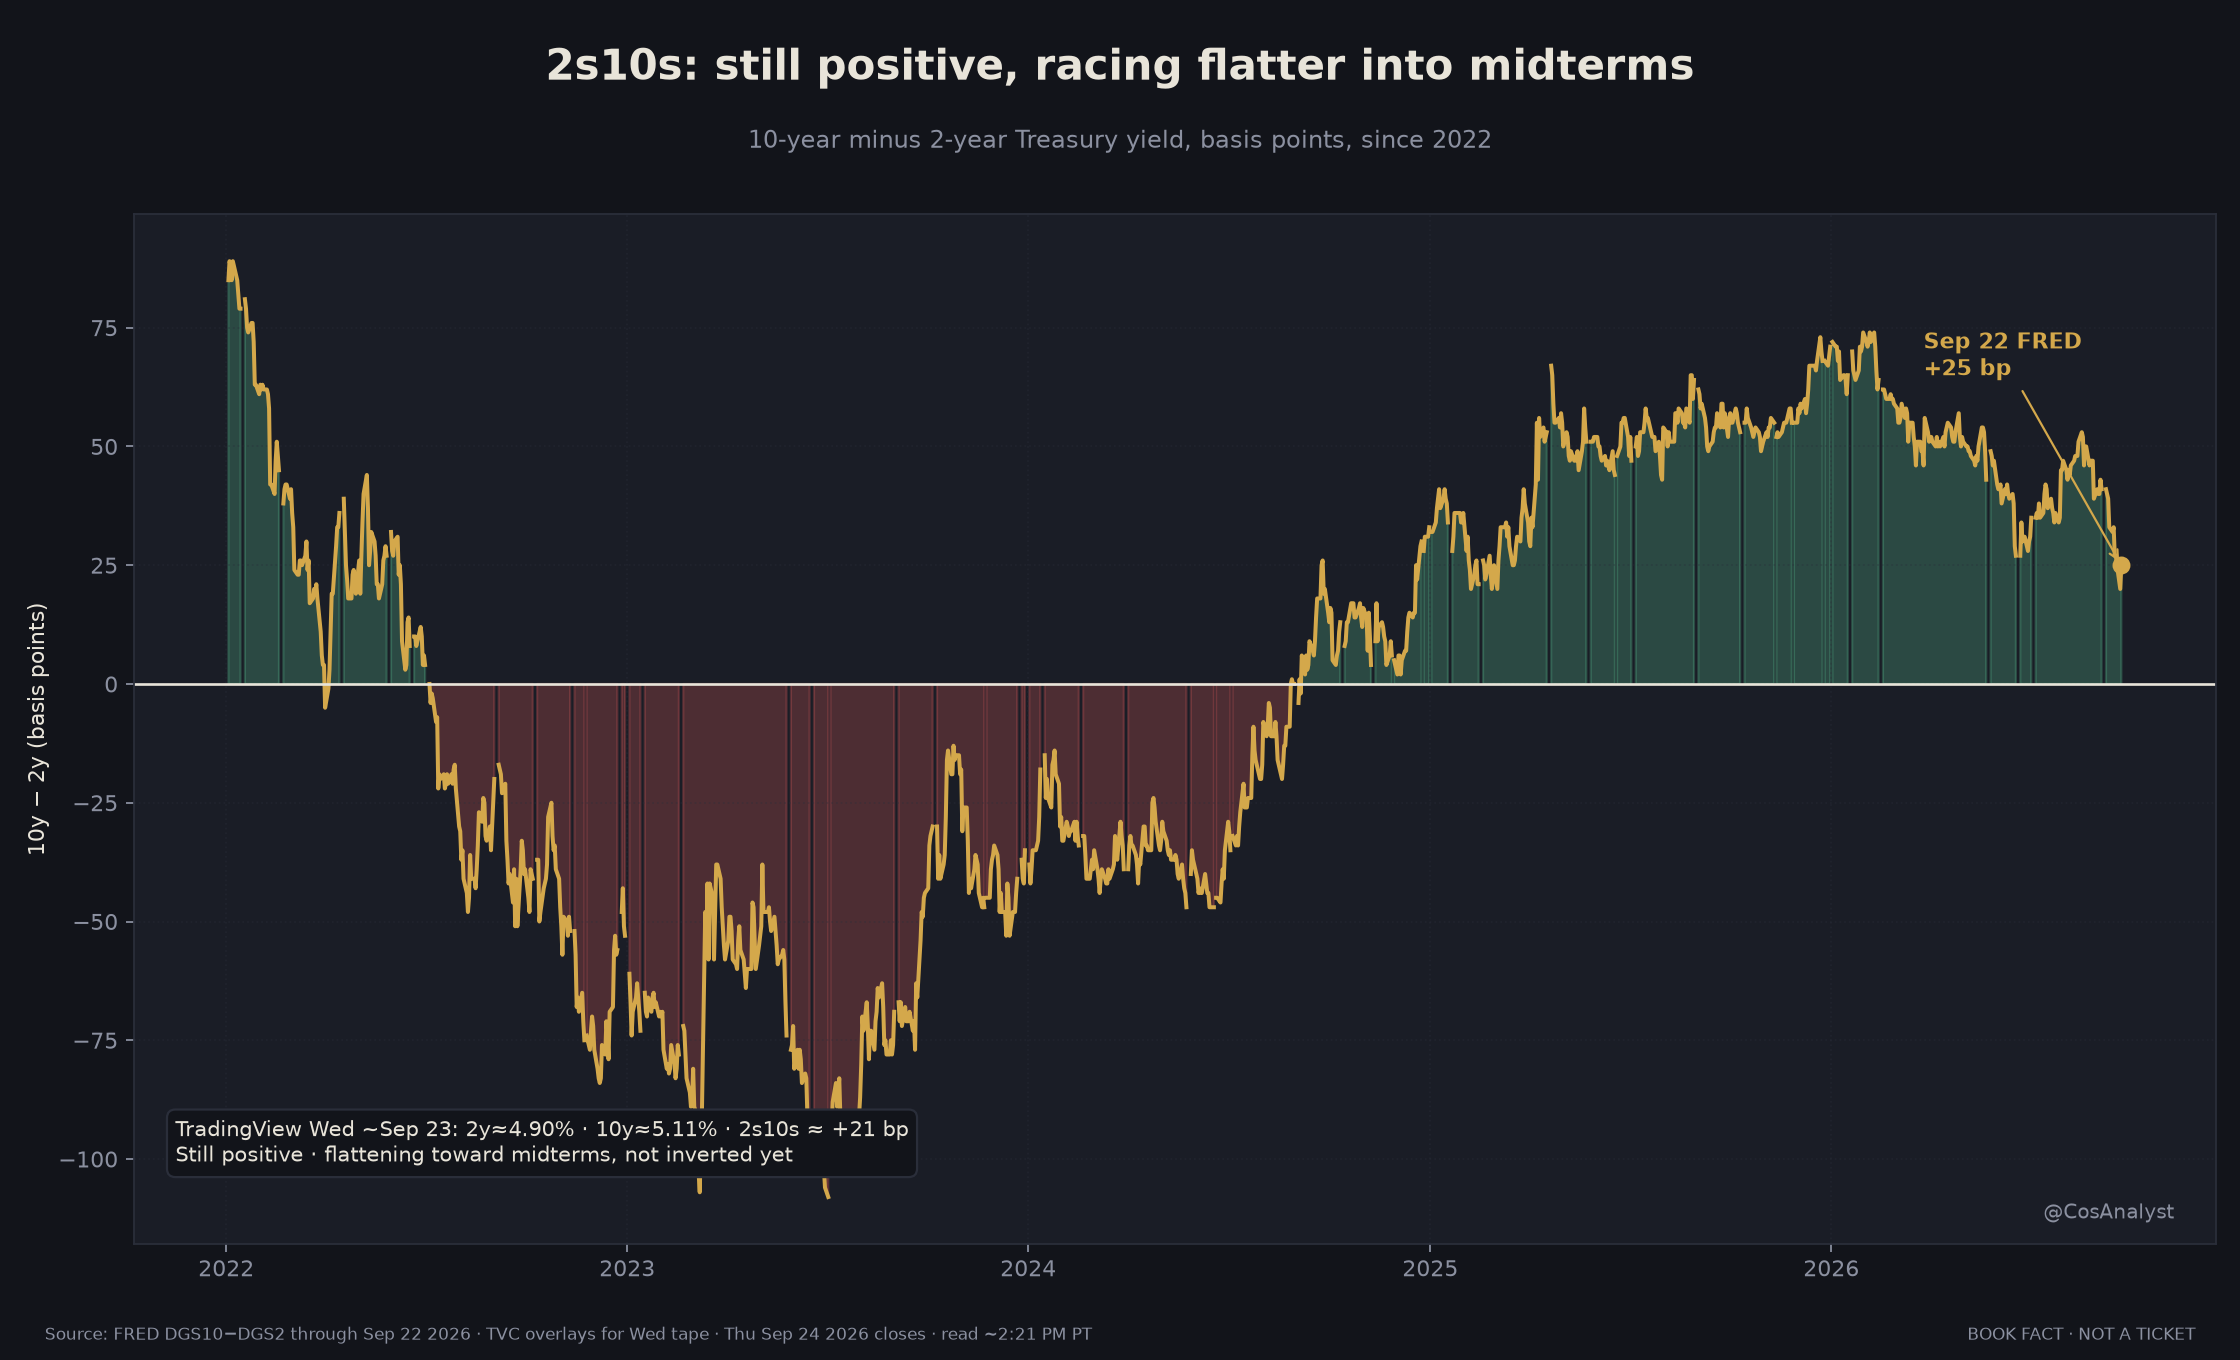
The yield curve adds a second warning. The gap between the 10-year and 2-year yields (the 2s10s) was about +25 bp on Tuesday and roughly +21 bp on Wednesday, with the 2-year near 4.90%. It is still positive. But it has fallen from about +74 bp in late January and is heading toward zero right into the midterms. That flattening is the Fed hiking story showing up in the curve.
What history says (and what it does not)
We checked every time since 1990 that the 10-year closed above 5% after spending at least 60 trading days below it. That happened four times with a full follow-up window: February 1999, November 2001, April 2006 and June 2007. The latest one opened on September 16, 2026.
Three months later, the S&P 500 was lower in three of four cases. The median three-month return was about -2.5%. Six months out, the results were split evenly.
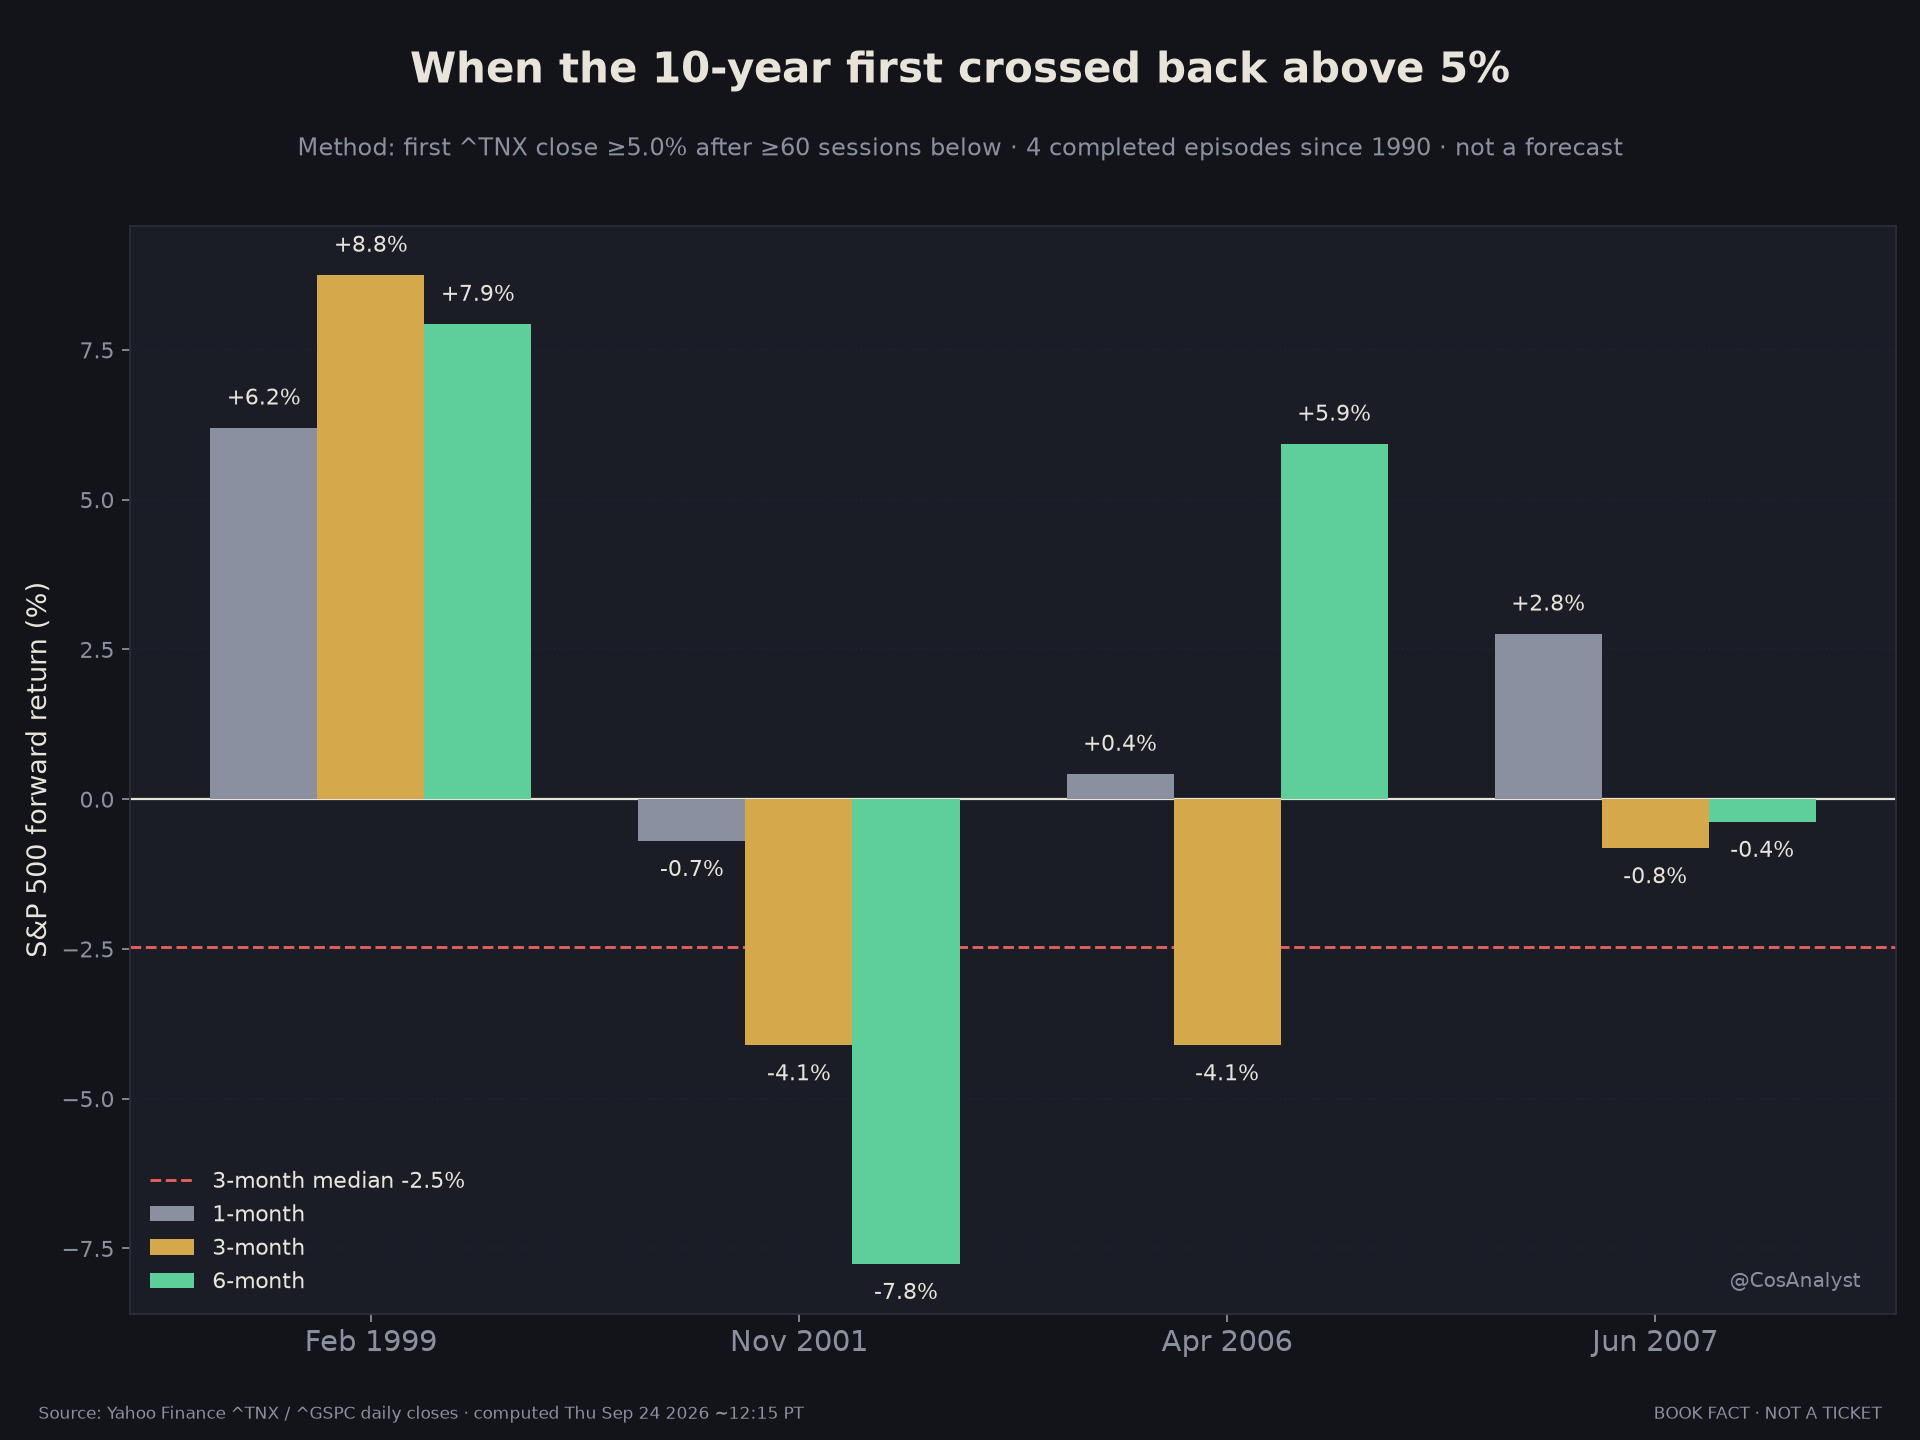
Four data points are not a law, and 1999 kept rallying. The honest read: a 10-year above 5% has not been a friendly backdrop for the next quarter, but it has not guaranteed a crash either.
Two paths into year-end and early 2027
Path 1: The rates market is right. The October 2 jobs report and October 14 CPI come in firm. The Fed hikes on October 28, a week before the midterms, and signals December is live. The 10-year holds above 5%. The fear gap closes the hard way, with the VIX catching up to the MOVE. Growth stocks, small caps and anything priced on distant earnings feel it first. The Russell 2000, already about 7.6% off its August high, is the canary.
Path 2: The data blinks. Payrolls cool or CPI surprises softer. Midterm optics make a pre-election hike harder to sell. October odds drop back under 50%, yields ease from their highs, and stocks get the relief rally they are already priced for. December stays in play, but the "one and done" story buys another month.
Today's odds lean toward Path 1. The data calendar decides.
Levels to watch
Prices are Thursday's US closing prices (1:00 PM PT). The options map is from 11:14 AM PT Thursday.
A quick translation of the options language first. A "put wall" is a strike price where a large pile of put options sits. When price trades below it, dealers who sold those puts tend to hedge in a way that can speed up moves in both directions.
QQQ closed Wednesday at 741.21 and closed Thursday at 741.10, inside the decision zone. The Cos options map at 11:14 AM PT had the pivot at 739, the put wall at 736 and the nearest call wall at 742.
- ABOVE 742: Buyers are absorbing the rates shock. The stock market's calm has a case.
- BETWEEN 736 and 742: Decision zone. Expect chop while bonds set the tone.
- BELOW 736: The put wall gives way and moves can extend. Rates are winning.
SPY closed Wednesday at 767.81 and closed Thursday at 767.18. The map had 768 above, 767 as the pivot and 765 below. Hold 768 and the index is digesting the move. Lose 765 and the bond market is setting the pace.
What to watch next
- Oct 2, jobs report (September). The first hard test of the hike odds.
- Oct 14, CPI (September). The print most likely to push October odds across 50% in either direction.
- Oct 27-28, FOMC. Decision Oct 28, one week before Election Day.
- Nov 3, midterm elections.
- Nov 6 jobs report and Nov 10 CPI. The bridge to December.
- Dec 8-9, FOMC. Decision Dec 9 with fresh projections and a new dot plot.
- The 10-year versus 5%, and the MOVE versus the VIX. If the gap closes, watch which one moves.
The takeaway
The Fed did not just hike. It told you why it might need to again. The dot plot leans higher, and a sitting governor used the words "out of position."
The bond market believes them. October odds are in the mid-60s to about 70%, depending on the source. December is above 70%. The 10-year is above 5% and the 30-year is at its highest since 2004.
The stock market mostly doesn't believe it yet. The VIX is still in the teens.
That gap is the story into year-end. It doesn't have to end in a crash. It does have to close. Either the data cools and bonds were early, or the Fed follows through and stocks were asleep.
Cos's read: when the Fed, the dot plot and the bond market all point the same way, the burden of proof sits with the calm. Respect the calendar and the levels, and let October 2 and October 14 decide which market blinks first.
BOOK FACT · NOT A TICKET. CosAnalyst research. Publisher + AI-assisted. Not financial advice. Nothing here is a recommendation to buy or sell any security. Probabilities and prices move. Levels are interim marks, not orders. Do your own research.
Sources / as-of
As-of: Thu Sep 24, 2026. Yields, VIX, QQQ and SPY are US closes (1:00 PM PT) from Yahoo Finance. MOVE is Yahoo's Thursday value read ~2:21 PM PT. Polymarket odds read ~2:18 PM PT. Options map from 11:14 AM PT.
- federalreserve.gov (FOMC statement, Sep 16)
- federalreserve.gov (Summary of Economic Projections)
- federalreserve.gov (Governor Barr, Sep 23)
- federalreserve.gov (FOMC calendar)
- polymarket.com (Fed decision in October)
- polymarket.com (Fed decision in December)
- actionforex.com (CME FedWatch October reading)
- fred.stlouisfed.org (DGS2, DGS10, DGS30)
- bls.gov (Employment Situation schedule)
- bls.gov (CPI schedule)
- Yields, VIX, MOVE, Russell 2000, QQQ, SPY: Yahoo Finance (^TNX, ^TYX, ^VIX, ^MOVE, ^RUT, QQQ, SPY), Sep 24, 2026
- Historical study: Yahoo Finance ^TNX and ^GSPC daily closes since 1990, method as stated in Chart 5