
Key takeaways
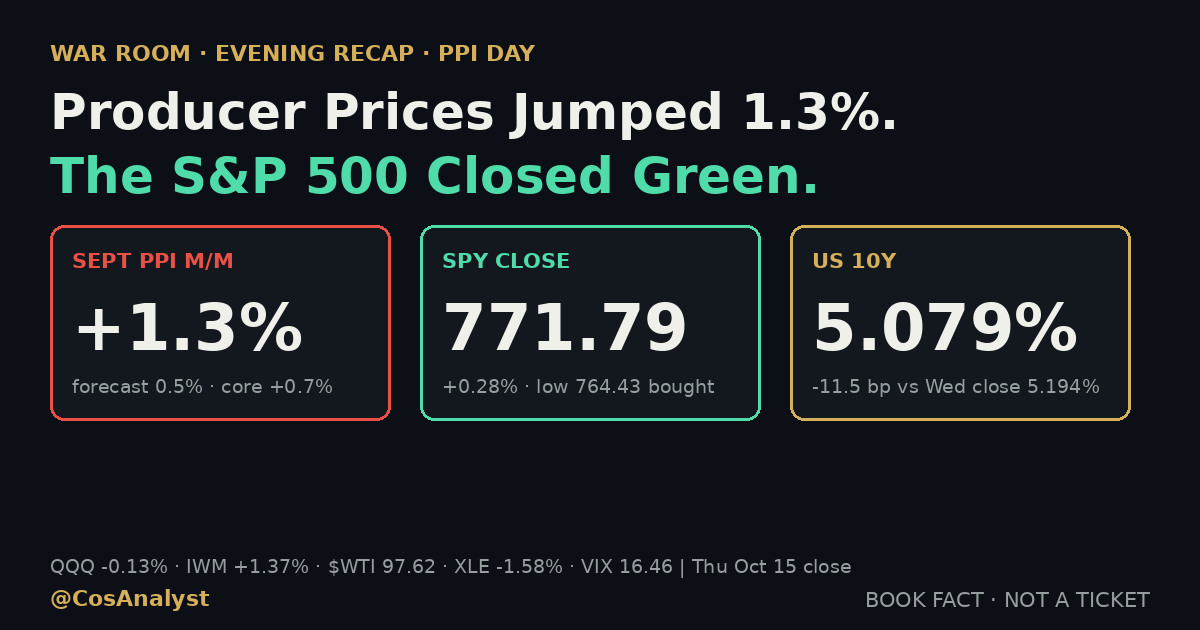
- Producer prices rose 1.3% in September, the biggest monthly jump since March 2022, against a 0.5% forecast, and the S&P 500 closed green anyway. SPY finished at 771.79 (+0.28%) and the S&P 500 index at 7,744.06 (+0.33%), after SPY gapped to 764.43 on the print (BLS, TradingView).
- The 10-year Treasury yield fell 11.5 basis points to 5.079%, from Wednesday's 5.194% close. The 2-year fell 4.9 basis points to 4.757%, and the dollar index fell 0.53% to 101.983.
- Breadth did the work. The equal-weight S&P 500 (RSP) and small caps (IWM) both gained 1.37% while the Nasdaq-100 (QQQ) lost 0.13%. Eight of the 11 sector SPDRs closed green.
- $WTI rose 2.7% to 97.62 after an 8.557 million barrel EIA crude draw, yet XLE fell 1.58%. Energy stocks never followed crude higher.
- October Fed hike odds are 27.5% on Polymarket, December is 78.5%, and Fed Chair Kevin Warsh speaks tonight at 8:30 PM PT. Friday is monthly options expiration.
A 1.3% jump in producer prices should have ruined a Thursday. It did not. SPY gapped down to 764.43 on the PPI number, then bought back all of it and closed at 771.79, up 0.28% and about a dollar under its 772.87 high. The S&P 500 index finished up 0.33%, small caps rallied 1.37%, and the 10-year Treasury yield fell about 12 basis points. Hot inflation, falling yields, green stocks.
Stocks close higher despite the hot PPI: the S&P 500 bought the dip
The shape of the day was a V. Premarket, our morning PPI note had SPY indicated down 0.29% and QQQ down 1.18%. At the regular-session low SPY was 764.43, down 0.68% from Wednesday's close of 769.60. From there buyers took over and never let go. SPY closed 1.08 below its high of 772.87, and the S&P 500 index closed at 7,744.06, 10 points under its high of 7,754.15.
| Close, Thu Oct 15 | Last | Change vs Wed close | Day range |
|---|---|---|---|
| SPY | 771.79 | +0.28% | 764.43 to 772.87 |
| S&P 500 index | 7,744.06 | +0.33% | 7,669.66 to 7,754.15 |
| QQQ | 728.00 | -0.13% | 715.435 to 729.43 |
| IWM | 275.08 | +1.37% | 270.85 to 275.19 |
| RSP (equal weight) | 215.00 | +1.37% | 212.79 to 215.02 |
| VIX | 16.46 | -2.43% | 16.34 to 18.01 |
TradingView marks at about 1:49 PM PT / 4:49 PM ET, after the 4:00 PM ET cash close. Changes are versus Wednesday's close.
Every index we track closed better than the premarket read. The Nasdaq-100 was the only major index in the red, and by 0.13% it was barely there. VIX peaked at 18.01 and closed at 16.46, a level well short of a panic reading. S&P 500 futures (ES) were up about 0.25% and Nasdaq-100 futures (NQ) down about 0.17%, both still trading after the cash close.
September PPI: the biggest monthly jump since March 2022
The Bureau of Labor Statistics said the Producer Price Index for final demand rose 1.3% in September, seasonally adjusted, after 0.5% in August. The BLS called it the largest advance since a 1.7% rise in March 2022. Core PPI, less foods and energy, rose 0.7% against a 0.3% forecast. Over 12 months the headline rate was 6.3% against a 5.3% forecast, and core was 5.0% against 4.4%. Energy did most of the work: final demand energy rose 10.8% and gasoline 20.3%. The full breakdown is in our morning PPI note.
| Thursday data, Oct 15 | Actual | Forecast | Prior |
|---|---|---|---|
| PPI m/m (Sept) | +1.3% | 0.5% | 0.5% |
| Core PPI m/m | +0.7% | 0.3% | 0.2% |
| PPI y/y | 6.3% | 5.3% | 5.6% |
| Core PPI y/y | 5.0% | 4.4% | 4.8% |
| Retail sales m/m | +0.8% | 0.3% | 1.3% |
| Retail control group | +0.1% | 0.3% | 1.2% |
| Initial jobless claims | 199K | 200K | 198K |
| Empire State (Oct) | 25.5 | 10.3 | 7.6 |
| Philadelphia Fed (Oct) | 20.9 | 28.4 | 37.8 |
| EIA crude stocks (week ended Oct 9) | -8.557M | -0.3M | -3.186M |
Actuals from BLS, Census, the Department of Labor, the New York and Philadelphia Feds, and the EIA; forecasts and priors from the TradingView economic calendar.
The rest of the morning data pulled in two directions. Retail sales rose 0.8% against 0.3%, but the control group, which feeds GDP, rose only 0.1% against 0.3%, so shoppers spent more dollars and did not buy much more. The Empire State index jumped to 25.5 against 10.3, while the Philadelphia Fed slipped to 20.9 against 28.4. A hot price print with a soft control group is the kind of mix the bond market can look through, and it did.
The 10-year Treasury yield falls about 12 basis points
The 10-year yield was 5.079% at about 1:49 PM PT, down 11.5 basis points from Wednesday's 5.194%. The day's range was 5.039% to 5.156%, so yields were lower than Wednesday's close for the entire session. The 2-year was 4.757%, down 4.9 basis points. HYG, the high-yield bond ETF, gained 0.42%, a sign credit was firmer, not stressed.
Elsewhere the dollar index fell 0.53% to 101.983 and gold gained 1.56% to $4,169.25. Bitcoin (Coinbase) traded at $82,216, up 0.75%, within a range of $79,711 to $82,520. Here is our read, not a certainty: bond traders treated an energy-driven producer-price spike as a growth and margin story, not as a reason for the Fed to hurry. The pattern is the same one flagged in our Seoul circuit breaker note overnight. Yields are still above 5%, so "falling" is relative, and a single Fed speech tonight can change the tone.
The Nasdaq-100 ETF was down 1.85% at its low. It closed down 0.13%.
QQQ traded 715.435 to 729.43, a range of 1.92% of Wednesday's close, against 1.10% for SPY. At the low QQQ was 1.85% under Wednesday's 728.95. It then recovered so completely that its session high of 729.43 sat above Wednesday's close, and it finished at 728.00, off 0.95 on the day. Intraday, the Nasdaq-100 stretched much farther than the S&P 500, as our midday note said it was doing at 1.46% versus 0.88%.
Semiconductors carried the weakness. SMH, the chip ETF, was down about 4.3% at its 540.59 low and closed at 558.84, down 1.04% and still under Wednesday's 564.74 close. XLK (technology) finished down 0.65%. The selling stayed in semis and AI names while the rest of the tape rallied.
Small caps rally and the equal-weight S&P 500 leads
This was a breadth day. RSP, the equal-weight S&P 500, and IWM, the Russell 2000 ETF, both gained 1.37%, a gap of about 1.5 percentage points over QQQ. Both closed within 0.1% of their highs. Eight of the 11 sector SPDRs finished green.
| Sector close, Thu Oct 15 | Last | Change |
|---|---|---|
| XLV (health care) | 177.19 | +1.86% |
| XLB (materials) | 50.56 | +1.79% |
| XLY (consumer discretionary) | 113.41 | +1.71% |
| XLC (communication services) | 112.44 | +1.46% |
| XLF (financials) | 55.27 | +1.38% |
| XLRE (real estate) | 41.99 | +1.21% |
| XLP (consumer staples) | 86.68 | +0.72% |
| XLI (industrials) | 167.89 | +0.51% |
| XLU (utilities) | 41.65 | -0.17% |
| XLK (technology) | 189.19 | -0.65% |
| XLE (energy) | 66.56 | -1.58% |
| SMH (semiconductors) | 558.84 | -1.04% |
TradingView closes at about 1:49 PM PT / 4:49 PM ET. SMH is a sub-industry ETF, not one of the 11 sector SPDRs.
Notice who led: health care, materials, consumer discretionary, communications and financials, a mix of cyclicals and defensives rather than the pure defensive bid of Wednesday. That is a risk-on rotation inside a hot-inflation day, and it is the opposite of what the PPI headline implied.
$WTI up 2.7%, XLE down 1.6%: crude and energy stocks split
$WTI, the front-month crude future, was trading at 97.62 after the stock close, up 2.53 or 2.66% from Wednesday's close of about 95.09, within a range of 93.58 to 98.32. The EIA reported that commercial crude stocks fell 8.557 million barrels to 415.577 million in the week ended Oct 9, against a forecast draw of 0.3 million, while gasoline stocks rose 3.518 million. Our midday EIA note has the full report.
XLE, the energy sector ETF, finished at 66.56, down 1.58% from 67.63. It opened at 67.90, which was its high of the day, and never got back there. Crude gained about 2.7% and energy stocks lost about 1.6% on the same day. As we said at midday, we have three working explanations: equities price the longer-dated oil curve, energy shares were a funding source for the rotation, and a sharp oil move in a hot-PPI week raises policy risk. The close did not settle the question.
Movers: Micron reverses, AMD and Nvidia lag
| Stock, close Oct 15 | Last | Change | Note |
|---|---|---|---|
| MU | 931.24 | +1.87% | Low 858.00, closed at the high |
| MSFT | 539.44 | +1.08% | Mag 7 leader |
| GOOGL | 349.22 | +0.45% | |
| AMZN | 254.76 | +0.27% | |
| META | 736.72 | -0.11% | Low 715.58, recovered |
| AAPL | 342.00 | -0.28% | |
| AVGO | 344.33 | -0.55% | |
| TSLA | 362.44 | -1.29% | |
| AMD | 562.23 | -1.50% | Low 530.09, about 7% under Wed close |
| NVDA | 217.23 | -1.84% | AI complex laggard |
TradingView closes. Percent changes are versus Wednesday's close.
The Micron stock reversal is the picture of the day in one name. MU was down about 6% at its 858.00 low, then rallied to 931.24, up 1.87% and a hair under its 931.65 high. AMD fell about 7% at its low and closed down 1.50%. META dropped about 3% at its low and closed down 0.11%. Microsoft led the mega caps at +1.08%, while Nvidia (-1.84%) and Broadcom (-0.55%) kept chips heavy.
Fed rate hike odds for October: the crowd did not budge
Polymarket prices a 25 basis point hike at the Oct 27-28 meeting at 27.5% as of about 1:50 PM PT, with no change at 72.5%. For the record, the day ran like this: 30.5% at Wednesday's close, 25.5% at 5:46 AM PT, 27.5% at about 9:51 AM PT and 27.5% now. A 1.3% PPI left October hike odds within two points of where they began Thursday, in a 25.5% to 27.5% band. December is a different story: a 25 basis point hike is 78.5%, no change is 18.5%, and a 50 basis point hike is 3.25%. The market says a hike is coming, just not necessarily in October. We lay out how we read these numbers in our October and December hike odds note.
How this morning's and midday's setups played out
Our morning note laid out three scenarios and flagged that, before the print, at-the-money straddles priced Thursday moves of about 0.69% in SPY and 1.47% in QQQ (desk read of a delayed CBOE chain). The close-to-close moves were +0.28% and -0.13%, both inside those numbers. SPY's low of down 0.68% touched the edge of its implied move almost exactly, and QQQ's low of down 1.85% went past its own.
- Yields keep falling and chips keep selling: partly right. The 10-year fell all day and SMH closed down 1.04%, but the rest of the market rallied instead of only defensives.
- Yields reverse higher after the open: did not happen. The day's high was 5.156% and the 10-year closed 7.9 basis points under it.
- Chips hold above Wednesday's 564.74 and QQQ recovers: half right. QQQ recovered to within 0.13% of Wednesday's close, but SMH closed at 558.84, below 564.74.
- Midday: $WTI holds near 98 and XLE catches up, or XLE keeps lagging: $WTI held at 97.62, within 0.7% of its high, and XLE did not catch up, closing down 1.58% against down 1.61% at midday. The second scenario won.
Nothing there is a trade call. It is a check on whether the framework fit the tape, and mostly it did.
What to watch tonight and Friday
- Thu Oct 15, 8:30 PM PT (11:30 PM ET): Fed Chair Kevin Warsh speaks (high importance on the TradingView calendar).
- Fri Oct 16, 5:30 AM PT (8:30 AM ET): import prices (forecast +0.8%, prior +0.7%) and export prices (forecast +1.0%, prior +0.6%).
- Fri Oct 16, 6:15 AM PT (9:15 AM ET): industrial production (forecast +0.4%, prior 0.0%).
- Fri Oct 16, 11:00 AM PT (2:00 PM ET): monthly budget statement.
- Fri Oct 16: monthly options expiration. For the mechanics, see our explainers on positive versus negative gamma and gamma exposure.
- Oct 27-28: FOMC meeting.
Three ways Warsh can land
- Patience language: it would fit the bond market's bid and the Polymarket odds, and the rotation into breadth could extend into Friday's open.
- Urgency language: it would put the 1.3% PPI and $WTI near $98 back in front, and futures would have to price it before the cash open.
- A speech that avoids the data: the 10-year, now 5.079%, is likely to take its cue from Friday's import and export prices.
We do not know which of these wins. We know the question: does the bond market keep looking through inflation, and does the breadth rally survive the first headline from Warsh.
FAQ
Why did the S&P 500 close higher after a hot PPI report?
September PPI rose 1.3% against a 0.5% forecast, but SPY bought back a gap down to 764.43 and closed at 771.79, up 0.28%. The 10-year Treasury yield fell 11.5 basis points to 5.079%, retail sales control group growth was only 0.1%, and breadth was strong, with small caps and the equal-weight S&P 500 both up 1.37%. Our read is that the market treated the producer-price jump as an energy-driven growth story rather than as a reason for the Fed to hike in October.
Why did the 10-year Treasury yield fall after the PPI?
The 10-year yield was 5.079% at about 1:49 PM PT, down 11.5 basis points from Wednesday, even though PPI rose 1.3% and core PPI rose 0.7%. Energy drove most of the jump, which markets already knew about, and the 0.1% retail sales control group did not show an overheating consumer. It is still above 5%, so the move is relative.
Why did oil rise while energy stocks fell?
$WTI rose about 2.7% to 97.62 after the EIA reported an 8.557 million barrel crude draw, but XLE fell 1.58% to 66.56 after opening at its high. Equities price the longer-dated oil curve, energy shares may have been a funding source for the rotation, and a sharp oil move in a hot-PPI week adds policy risk. These are our readings, not confirmed causes.
What are the Fed hike odds for October, and when does Kevin Warsh speak tonight?
Polymarket priced a 25 basis point hike at the Oct 27-28 meeting at 27.5% at about 1:50 PM PT, with no change at 72.5% and a December hike at 78.5%. Fed Chair Kevin Warsh speaks tonight at 8:30 PM PT (11:30 PM ET). Friday Oct 16 is monthly options expiration, with import and export prices at 5:30 AM PT and industrial production at 6:15 AM PT.
Follow the desk
Follow @CosAnalyst on X for the read on Warsh tonight and Friday's expiration as they land. Join the free Telegram alerts channel, Free Index & BTC Trade Alerts. It posted no signals on Thursday, and sitting out when the setup is not there is part of the plan. Nothing there is financial advice.
BOOK FACT · NOT A TICKET. CosAnalyst research and analysis, not financial advice or a trade recommendation. Producer price figures are from the Bureau of Labor Statistics Producer Price Index news release for September 2026 (8:30 AM ET, Oct 15). Retail sales are from the Census Bureau advance report, in nominal dollars. Crude, gasoline and Cushing figures are from the U.S. Energy Information Administration Weekly Petroleum Status Report for the week ended Oct 9, 2026. Forecasts, priors and the economic calendar are from TradingView. Quotes, closes, sector ETFs, $WTI, yields, the dollar index, gold, Bitcoin and VIX are TradingView marks at about 1:49 PM PT / 4:49 PM ET, Thu Oct 15, 2026, after the 4:00 PM ET cash close; yields, futures and Bitcoin were still trading. Wednesday closes are TradingView daily closes. Fed odds are from Polymarket as of about 1:50 PM PT. The implied-move figures quoted from our morning note are a CosAnalyst desk read of a delayed CBOE options chain. FOMC dates are from federalreserve.gov. Prediction-market odds and market data change quickly.