
Key takeaways
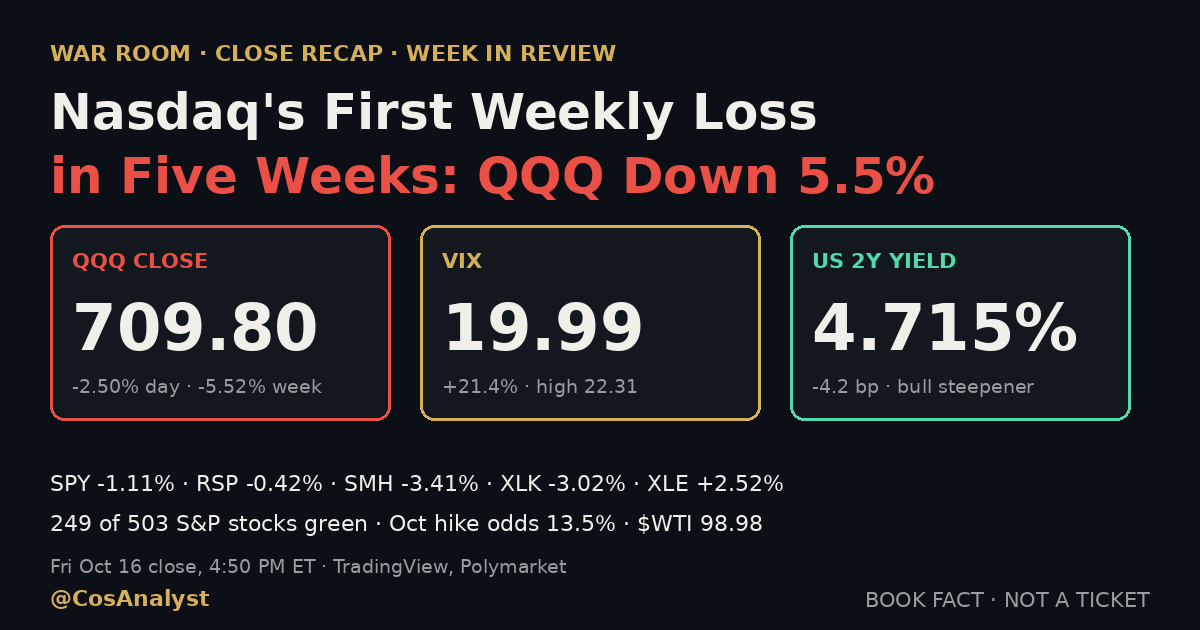
- QQQ closed at 709.80, down 2.50% on the day and 5.52% on the week, the Nasdaq-100's first weekly loss in five weeks. It ended 2.57 points above its 707.23 low. Four straight weekly gains are over, and Friday alone was 18.20 of the week's 41.47 points lost.
- The S&P 500 fell far less than the Nasdaq. SPY closed at 763.25 (-1.11%, week -1.97%), the equal-weight S&P 500 (RSP) lost only 0.42%, and 249 of 503 S&P 500 stocks finished green. That is a megacap and tech drag, not a broad liquidation.
- The VIX jumped 21.4% to 19.99 on monthly options expiration day, after opening at 16.02. Its high was 22.31.
- Yields fell and Fed hike odds stayed low, yet tech sold harder. The 2-year yield dropped 4.2 basis points to 4.715% while the 10-year finished flat at 5.081%, a bull steepener by the close after a bear steepener at midday. Polymarket put an October hike at 13.5%. That points to growth and AI-spending worry, not a Fed scare.
- Energy, utilities and staples led. XLE rose 2.52%, XLU 1.34% and XLP 1.08%, against XLK at -3.02% and the semiconductor ETF SMH at -3.41%. $WTI closed near $99 at $98.98.
Midday, the Nasdaq was heading for its first weekly loss in five weeks. By the close it had earned it. QQQ broke its opening range early, never got back, and finished within 2.6 points of its 707.23 low, down 2.50% on the day and 5.52% on the week. The S&P 500 lost 1.11%, but almost half of its members closed green. Yields fell, hike odds fell, and the selling in AI chips, software and cyber went on anyway. This is the close and the week in review.
Nasdaq first weekly loss in five weeks: QQQ's 5.5% weekly drop
QQQ ended the week at 709.80, down 5.52% from the prior Friday's 751.27. On TradingView's weekly bars the previous down week ended Sep 11, then QQQ gained four weeks in a row before this one. The weekly low of 707.23 is Friday's low, so the market closed within 2.57 points of the lowest print of the week.
| QQQ week ending | Weekly close | Change vs prior week |
|---|---|---|
| Fri Sep 11 | 714.88 | -0.57% |
| Fri Sep 18 | 721.45 | +0.92% |
| Fri Sep 25 | 744.50 | +3.19% |
| Fri Oct 2 | 749.58 | +0.68% |
| Fri Oct 9 | 751.27 | +0.23% |
| Fri Oct 16 | 709.80 | -5.52% |
TradingView weekly bars, regular session. The Sep 11 week followed a prior weekly close of 718.96. Weeks are Friday closes; the Sep 11 week was a four-day week after Labor Day.
Friday was the damage. Thursday's QQQ close was 728.00, so Friday's 18.20 point drop is about 44% of the week's 41.47 point loss in a single session. QQQ opened at 725.52, traded as high as 725.96, broke its opening range early and never got back. The 715 area we flagged in our midday recap did not hold: it gave way to the 707.23 low. SPY's low of 760.64 took out Thursday's 764.43 low, and QQQ's low took out Thursday's 715.44.
| Close, Fri Oct 16 | Close | Change vs Thu close | Day range |
|---|---|---|---|
| SPY | 763.25 | -1.11% (week -1.97%) | 760.64 to 773.25 |
| QQQ | 709.80 | -2.50% (week -5.52%) | 707.23 to 725.96 |
| IWM (small caps) | 270.44 | -1.69% | 269.88 to 275.91 |
| RSP (equal weight) | 214.09 | -0.42% | 213.33 to 216.30 |
| SMH (semiconductors) | 539.79 | -3.41% | 539.07 to 554.68 |
| VIX | 19.99 | +21.4% | 15.72 to 22.31 |
| S&P 500 futures (ES) | 7,702.50 | -1.14% | vs settle |
| Nasdaq-100 futures (NQ) | 29,379.75 | -2.53% | vs settle |
Cash closes are TradingView regular-session closes pulled 1:45 to 1:50 PM PT (4:45 to 4:50 PM ET), after the 4:00 PM ET close. Futures were refreshed at 1:53 PM PT / 4:53 PM ET and were still trading. Thursday closes: SPY 771.79, QQQ 728.00, IWM 275.08, RSP 215.00, SMH 558.84, VIX 16.46.
VIX near 20 on options expiration day: the fear bid built all day
The VIX closed at 19.99, up 3.53 points or 21.4%, on monthly options expiration day. It opened at 16.02, touched a low of 15.72 and hit 22.31 at the high, so the fear bid arrived after the open and kept building into the close. By intraday range, the Nasdaq-100 ETF moved 2.57% from high to low against 1.63% for SPY and 2.19% for IWM, measured over the prior close. Expiration day produced a wide range, not a quiet one.
Equal weight vs cap weight S&P 500: half the index closed green
249 of 503 S&P 500 stocks closed up (TradingView screener), down from 255 at midday. The cap-weighted SPY lost 1.11% while the equal-weight S&P 500 (RSP) lost 0.42%, so the average stock fell less than half as much as the index. The drag was concentrated in a handful of the largest names. IWM, the small-cap ETF, lost 1.69%, so this was not a pure large-cap story either, but the weight sat in tech.
| Megacap, Fri Oct 16 | Change vs Thu close |
|---|---|
| AMD (528.75) | -5.95% |
| AVGO, Broadcom (328.75) | -4.52% |
| META (709.33) | -3.72% |
| GOOGL, Alphabet | -2.47% |
| TSLA | -2.13% |
| MSFT | -1.93% |
| AMZN | -1.87% |
| NVDA | -1.43% |
| AAPL (343.46) | +0.43% |
TradingView screener, close, with closing prices where the desk pack carries them. AAPL was the only green megacap.
Banks split: JPMorgan rose 1.25% while Goldman Sachs fell 1.12%. Credit was a little softer but not stressed: the high-yield bond ETF HYG closed at 76.86, down 0.35%.
AI chip selloff and software: who led the drop
Technology (XLK) lost 3.02%, communication services (XLC) lost 1.89%, and the semiconductor ETF SMH fell 3.41% to 539.79. Below the headline names, the AI hardware, storage, software and cyber groups did the damage. We list a catalyst only where one is sourced. Where it is not, the table says so.
| S&P 500 loser, Fri Oct 16 | Close | Change | Catalyst, as sourced |
|---|---|---|---|
| TWLO (Twilio) | 244.37 | -10.62% | Led software lower; no single catalyst confirmed |
| SMCI | 31.63 | -9.86% | AI hardware selling; no company-specific catalyst confirmed |
| FLEX | 90.46 | -8.16% | AI hardware; no company-specific catalyst confirmed |
| MRNA (Moderna) | 218.01 | -7.82% | Falls ahead of cancer vaccine data next week (Seeking Alpha), after 52-week highs Thursday |
| PANW (Palo Alto Networks) | 342.00 | -7.63% | Exploited PAN-OS zero-day CVE-2026-0322; CISA catalog listing with an Oct 17 federal deadline (Investing.com) |
| STX | 639.01 | -7.50% | AI storage; no company-specific catalyst confirmed |
| PLTR | 186.03 | -7.22% | Cyber and software group: profit-taking plus large AI developers moving into vulnerability detection (TradingKey) |
| DDOG | 247.11 | -7.19% | Same group as PLTR (TradingKey) |
| COHR | 232.90 | -7.06% | AI hardware; no company-specific catalyst confirmed |
| P | 124.01 | -7.04% | No company-specific catalyst confirmed |
| FTNT (Fortinet) | 169.13 | -7.03% | Cyber group (TradingKey) |
| CRWD (CrowdStrike) | 227.39 | -7.02% | Cyber group (TradingKey) |
TradingView screener, close. Catalysts are from headlines carried at midday (Investing.com, TradingKey, Seeking Alpha); where none is listed we did not find a confirmed one. STX and COHR closed 37% and 40% below their 3-month highs.
Two points on the sourcing. The AI hardware and storage names (SMCI, FLEX, STX, COHR) fell 7% to 10% with no company-specific catalyst we can confirm, which is what a group selloff looks like. And the cyber and software drop has a mix of causes: a real exploited vulnerability at Palo Alto Networks, and a group move in Palantir, Datadog, Fortinet and CrowdStrike that TradingKey attributes to profit-taking and AI developers moving into vulnerability detection.
Headlines on TradingView today carried Michael Burry's "Red October" warning on QQQ and SMH (Benzinga, Stocktwits) and "AI stock sell-off could catch bearish investors off guard" (Stocktwits). We cite those at headline level only; we did not open the underlying pieces and do not endorse the call.
Energy stocks rally: XLE leads, defense and pipelines follow
| Sector ETF, Fri Oct 16 | Change vs Thu close |
|---|---|
| XLE (Energy) | +2.52% |
| XLU (Utilities) | +1.34% |
| XLP (Staples) | +1.08% |
| XLB (Materials) | +0.71% |
| XLF (Financials) | +0.45% |
| XLRE (Real estate) | +0.40% |
| XLI (Industrials) | -0.08% |
| XLV (Health care) | -0.27% |
| XLY (Consumer discretionary) | -0.84% |
| XLC (Communication services) | -1.89% |
| XLK (Technology) | -3.02% |
| SMH (Semiconductors) | -3.41% |
SPDR sector ETFs and SMH, TradingView close. Eleven sector SPDRs: six green, five red.
The midday rotation got stronger into the close on both ends. Energy, utilities and staples led, with XLE up 2.52% as $WTI closed at $98.98, up 1.03%, from a low of $95.29 and a high of $99.34. Technology went the other way. Our Thursday close note found energy stocks lagging crude after the EIA draw. Friday, the stocks caught up.
| S&P 500 gainer, Fri Oct 16 | Change | Context, as sourced |
|---|---|---|
| TRGP | +4.37% | Energy and pipelines; $WTI near $99 |
| FANG | +4.27% | Energy; $WTI near $99 |
| KMI | +4.20% | Pipelines; reports Wed Oct 21 after the close |
| APA | +4.07% | Energy; $WTI near $99 |
| NOC (519.86) | +4.05% | Defense; no single verified catalyst today; reports Tue Oct 20 before the open |
| RTX (193.92) | +3.73% | Defense; no single verified catalyst today; reports Tue Oct 20 before the open |
| LMT (552.09) | +3.65% | Defense; no single verified catalyst today; reports Thu Oct 22 before the open |
| EOG / EQT | +3.53% / +3.53% | Energy; $WTI near $99 |
| NI | +3.47% | Utility; no catalyst cited |
TradingView screener, close. Earnings dates and before/after-the-close timing are from TradingView's earnings fields; exact release minutes are not confirmed.
We have no single verified catalyst for the defense rally. Seeking Alpha ran "Trump announces Montana testing range for hypersonic weapons, drones" on Thursday; treat it as context, not the confirmed cause. All three prime contractors report next week, so the group's next real data point is the earnings calls, not the headline.
Bull steepener: the 2-year yield fell, the 10-year did not
The 2-year Treasury yield closed at 4.715%, down 4.2 basis points on the day from a high of 4.783%. The 10-year closed at 5.081%, up 0.2 basis points, off a high of 5.131%. The gap between them is about 37 basis points.
That is a change of state from our midday recap, which read a bear steepener with the 10-year at 5.127% and the 2-year at 4.774%. Into the close, short yields fell and the 10-year gave back about 4.6 basis points from midday, so the 2-year fell more (about 5.9 basis points from midday). Read it as a bull steepener, led by the front end: the bond market bid the short end late rather than pushing long yields higher. Any midday read of rising long yields as the stock market's problem is stale.
Elsewhere, the dollar index closed at 101.78, down 0.22%. Gold closed at $4,167.96, down 0.08%. Bitcoin (Bitstamp) is $81,632, -0.61%, as of 1:53 PM PT, with a day range of 80,718 to 82,819, so crypto was not the source of Friday's stress. Futures were also refreshed at 1:53 PM PT: ES 7,702.50 (-1.14%) and NQ 29,379.75 (-2.53%).
Fed hike odds stayed low while tech sold: growth worry, not a Fed scare
Polymarket priced a 25 basis point October hike at 13.5% (bid 13, ask 14) at 1:53 PM PT, with no change at 86.5%. That is down 14 points in a day: roughly 27.5% into Fed Chair Kevin Warsh's Thursday evening remarks, and 12.5% at midday. December is 76.5% for a 25 basis point hike and 21.5% for no change, with no change up 3 points on the day. In plain terms, prediction markets cut the October hike to about a 1-in-7 chance in two days, even though import, export and producer prices all ran hot this week.
The wider 2026 markets moved the same way. "Another Fed rate hike in 2026?" is Yes at 78.5%, down 8 points on the day, and the hike-count market is two hikes at 69%, one at 20.5% (up 7 points) and three at 10.25% (down 7 points), as of the desk's 1:48 PM PT pull. Seeking Alpha's headline on Warsh's Thursday remarks was "Warsh sees AI as positive supply shock, avoids October rate signal." We cover how we read these odds in our hike odds note and the setup in our overnight Warsh note.
Put the pieces together. The 2-year yield fell, hike odds fell, and the 10-year did not rise, yet the Nasdaq-100 lost 2.50% and semiconductors lost 3.41%. A Fed scare would show up as higher short yields and higher hike odds. This did not. Our read is that the selling is about growth and AI-spending worry. That is an interpretation, not a proven cause: the tape does not tell us why anyone sold.
Friday's data: import, export and industrial production beat, TIC flows surge
| Fri Oct 16 data | Actual | Forecast | Prior |
|---|---|---|---|
| Import prices m/m (Sep) | 1.1% | 0.8% | 0.5% |
| Export prices m/m (Sep) | 2.2% | 1.0% | 1.2% |
| Industrial production m/m (Sep) | 0.7% | 0.4% | 0.1% |
| Monthly Treasury budget (Sep) | -$27B | -$29B | -$167B |
| Net long-term TIC flows (Aug) | +$279.2B | +$75.2B | -$27.9B |
TradingView economic calendar, actual versus forecast. TIC flows were released at the close.
Import prices, export prices and industrial production all beat. The budget deficit was a little smaller than forecast. The TIC number is the largest surprise: net long-term foreign purchases of US securities of +$279.2 billion against a $75.2 billion forecast, a big foreign inflow into US securities, released at the close. Context from earlier in the week: Thursday's producer prices rose 1.3% month over month against 0.5% expected, and 6.3% over 12 months against 5.3%, while the retail control group rose 0.1% against 0.3%. Apollo's chief economist called the PPI surge "the definition of stagflation," per a Stocktwits headline on TradingView. We cite that at headline level, as one economist's framing.
The week in review
- Thursday: the S&P 500 held up after a hot PPI, with SPY closing at 771.79 and QQQ at 728.00 (see our Thursday close note). Warsh spoke that evening.
- Friday morning: import and export prices beat, and the morning recap found the 2-year barely moving.
- Friday midday: our midday recap caught QQQ at 715.20, on Thursday's low, with a bear steepener in rates.
- Friday close: QQQ lost another leg to 709.80, the 2-year yield fell, and the week finished as a 5.52% loss for the Nasdaq-100 and 1.97% for SPY.
The takeaway for the week is the dispersion. The Nasdaq-100 lost 5.52%, the cap-weighted S&P 500 lost 1.97%, and money rotated into energy, utilities, staples and defense. A drop that large in the index leader, with the equal-weight index down far less on Friday, looks more like a leadership break than a broad sell-off. That is our read, not a forecast.
Next week's set-up: Tesla, Meta and Netflix earnings, Core PCE and GDP
We keep this list to what is in the desk calendar. Earnings dates and before/after-the-close timing are from TradingView's earnings fields; exact release minutes are not confirmed.
- Fri Oct 16, 6:00 PM ET (3:00 PM PT): the Fed's Goolsbee speaks.
- Mon Oct 19: NAHB housing index at 10:00 AM ET (forecast 31, prior 32). It is the 39th anniversary of the 1987 Black Monday crash (Seeking Alpha Catalyst Watch).
- Tue Oct 20: housing starts (1.30M forecast) and permits (1.40M) at 8:30 AM ET, pending home sales at 10:00 AM ET (0.0% month over month forecast). Earnings before the open: GM, MMM, ISRG, GE, NOC, RTX. After the close: NFLX.
- Wed Oct 21: EIA crude at 10:30 AM ET. Earnings: T before the open; TSLA, META, TXN, LRCX, IBM and KMI after the close. This is the big night for AI and megacap sentiment.
- Thu Oct 22: jobless claims at 8:30 AM ET (200k forecast). Earnings before the open: PG, LMT.
- Fri Oct 23: S&P flash PMIs at 9:45 AM ET (manufacturing 55.6, services 57.9) and final University of Michigan sentiment at 10:00 AM ET (46.3).
- During the week, per Seeking Alpha: Moderna's cancer vaccine data.
Beyond that is Oct 29. Polymarket favors a 3.1% year-over-year reading for September core PCE at 45%, with 3.0% at 30% (as of 1:53 PM PT). Q3 GDP is due around Oct 29 to 30, and Polymarket puts 3.0% or higher at 68.5%. The October FOMC market resolves around then. These are market-based odds, not forecasts from us.
Three questions for Monday
- Does QQQ hold the 707.23 low? It closed 2.57 points above it. A break below the week's low turns the weekly loss into a lower-low story.
- Does the AI and megacap complex stabilize before Wednesday night? Tesla and Meta report after the close on Oct 21, and TXN, LRCX and IBM report the same night.
- Does the equal-weight index keep outperforming? On Friday RSP lost 0.42% against 1.11% for SPY. If small caps and the average stock start to break as well, the selloff widens.
We do not know which one wins. We know the questions.
FAQ
Why did the Nasdaq have its first weekly loss in five weeks?
QQQ closed Friday at 709.80, down 2.50% on the day and 5.52% on the week from 751.27, ending four straight weekly gains. Selling was concentrated in AI chips and hardware, software and cybersecurity: SMH fell 3.41%, XLK fell 3.02%, and several S&P 500 names (SMCI, FLEX, STX, COHR, TWLO, PLTR, DDOG) fell 7% to 11%. Most of the AI hardware names had no company-specific catalyst we can confirm.
Why did the S&P 500 fall 1.1% when 249 of 503 stocks rose?
Because the index is cap-weighted. SPY lost 1.11% while the equal-weight S&P 500 (RSP) lost only 0.42%, and 249 of 503 S&P 500 stocks closed higher. Large tech names, including Meta (-3.72%), Broadcom (-4.52%) and AMD (-5.95%), carried the index down, while energy, utilities and staples were green.
Was Friday's selloff a Fed rate hike scare?
No. The 2-year Treasury yield fell 4.2 basis points to 4.715%, the 10-year was flat at 5.081%, and Polymarket put an October hike at 13.5% and a December hike at 76.5% as of 1:53 PM PT. October hike odds were roughly 27.5% on Thursday. Tech sold while yields and hike odds fell, which points to growth and AI-spending worry rather than a Fed scare. That is our interpretation, not a confirmed cause.
Why did energy stocks rally while tech sold?
Energy led the S&P 500: XLE rose 2.52% as $WTI closed at $98.98, up 1.03%, and pipeline and producer stocks such as TRGP, FANG, KMI and APA rose about 4%. Utilities (XLU +1.34%) and staples (XLP +1.08%) also led, so money rotated out of tech into energy and defensive sectors. Defense contractors NOC, RTX and LMT rose 3.7% to 4.1% with no single verified catalyst, and all three report next week.
Follow the desk
Follow @CosAnalyst on X for the read on next week's data and earnings. Join the free Telegram alerts channel, Free Index & BTC Trade Alerts. It posted one signal today, a Fox QQQ 5-minute long at 7:50 AM PT, and it was stopped out within minutes for a 1R loss; the first target was never reached. The same tally was posted on @CosAnalyst at the close. Showing the losses is part of the plan.
BOOK FACT · NOT A TICKET. CosAnalyst research and analysis, not financial advice or a trade recommendation. Cash-session quotes, ETFs, VIX, Treasury yields, the dollar index, $WTI, gold, sector ETFs, stock closes and S&P 500 breadth are TradingView regular-session closes and screener counts pulled 1:45 to 1:50 PM PT (4:45 to 4:50 PM ET), Fri Oct 16, 2026. Futures and Bitcoin were refreshed at 1:53 PM PT / 4:53 PM ET. QQQ weekly closes are TradingView weekly bars. Data actuals, forecasts and priors are from the TradingView economic calendar. Fed, Core PCE and GDP odds are from the Polymarket API as of about 1:53 PM PT; the 2026 hike-count markets are from the desk's 1:48 PM PT pull. Catalysts: Palo Alto Networks CVE-2026-0322 and the CISA listing from Investing.com; Palantir, Datadog, Fortinet and CrowdStrike from TradingKey; Moderna, Warsh and the defense-test-range and Black Monday headlines from Seeking Alpha; the Burry, Apollo and AI-selloff headlines from Benzinga and Stocktwits via TradingView, cited at headline level only. Earnings dates are from TradingView earnings fields. Free-channel outcome checked against TradingView QQQ 5-minute bars. Prediction-market odds and market data change quickly, and this page reflects the Friday close.