
Key takeaways
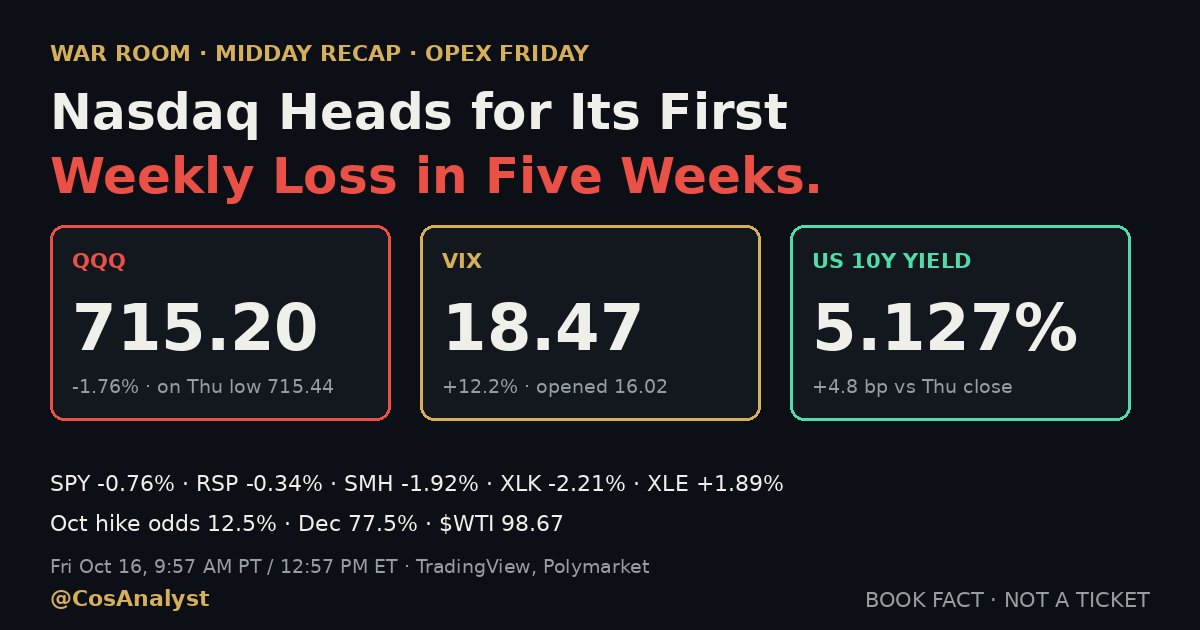
- The Nasdaq is headed for its first weekly loss in five weeks (AP, Investing.com). QQQ is 715.20, -1.76%, sitting on Thursday's 715.44 low, and SPY is 765.91, -0.76%. The VIX is 18.47, up 12.2%.
- The 10-year Treasury yield is 5.127%, up 4.8 basis points from Thursday, while the 2-year is 4.774%, up 1.7. That is a bear steepening: long yields are rising faster than short ones, and our morning recap's read of a quiet bond market is stale.
- The cap-weighted index is down far more than the average stock. 255 of 503 S&P 500 stocks are up, and the equal-weight S&P 500 (RSP) is -0.34% against SPY at -0.76%.
- Energy, utilities and staples are green while tech sells. XLE is +1.89%, XLU is +1.21% and XLP is +0.87%, against XLK at -2.21% and the semiconductor ETF (SMH) at -1.92%. $WTI is $98.67.
- Fed hike odds fell even as inflation data ran hot. Polymarket prices an October hike at 12.5%, from about 27.5% Thursday, and December at 77.5%. Industrial production rose 0.7% against a 0.4% forecast.
This morning's recap was about a 2-year yield that barely moved. By midday the story is the stock market. The Nasdaq is headed for its first weekly loss in five weeks, according to AP and Investing.com, and the selling is concentrated in AI chips, software and cybersecurity. QQQ is down 1.8% and sitting on Thursday's low, the VIX has jumped back above 18, and the 10-year yield is 5.127%. Under the surface, half the S&P 500 is green. This is a megacap and tech drag, not a broad liquidation.
Nasdaq heads for its first weekly loss in five weeks
According to AP and Investing.com, the Nasdaq is headed for its first weekly loss in five weeks, and Investing.com frames it as an AI stock selloff testing the Wall Street rally. Our live numbers show the Nasdaq-100 doing the damage. QQQ opened at 725.46, broke the 5-minute opening range low of 724.05 by about 6:40 AM PT, never reclaimed it, and has made lower highs all morning. It trades at 715.20, within a quarter point of Thursday's 715.44 low, and its day low of 714.98 is just under that level. SPY's Thursday low was 764.43, and SPY's day low of 765.72 is 1.29 above it.
One accuracy note. AP's snapshot at 11 AM ET had the S&P 500 down 0.1% and the Dow up 0.4%. The tape has weakened since, so the numbers below are our live TradingView marks, not that snapshot.
| Midday, Fri Oct 16 | Last | Change vs Thu close | Day range |
|---|---|---|---|
| SPY | 765.91 | -0.76% | 765.72 to 773.25 |
| QQQ | 715.20 | -1.76% | 714.98 to 725.96 |
| IWM (small caps) | 271.24 | -1.40% | 271.02 to 275.91 |
| DIA (Dow) | 519.68 | -0.29% | 519.48 to 525.09 |
| RSP (equal weight) | 214.27 | -0.34% | 214.14 to 216.29 |
| SMH (semiconductors) | 548.11 | -1.92% | 546.44 to 554.68 |
| S&P 500 futures (ES) | 7,729.00 | -0.80% | vs settle |
| Nasdaq-100 futures (NQ) | 29,599 | -1.81% | vs settle |
| Russell 2000 futures (RTY) | 2,742.9 | -1.40% | vs settle |
| VIX | 18.47 | +12.21% | 15.72 to 18.47 |
TradingView marks at about 9:57 AM PT / 12:57 PM ET. ETF changes are versus Thursday's close; futures are versus the prior settle. Thursday closes: SPY 771.79, QQQ 728.00, IWM 275.08, RSP 215.00, SMH 558.84, VIX 16.46.
Compare that with our morning recap, written at 5:52 AM PT. Pre-market, SPY was +0.16%, QQQ was -0.21%, RSP was +0.20% and the VIX was 15.98. The VIX has since opened at 16.02, touched a low of 15.72 and spiked to 18.47: the fear bid came in after the open, not before it.
Half the S&P 500 is green, so why is the index down?
255 of 503 S&P 500 stocks are up (TradingView screener, about 9:57 AM PT). With SPY at -0.76%, that split says the weight is in a handful of large names. The equal-weight S&P 500 is -0.34% against -0.76% for the cap-weighted ETF, so the average stock is falling less than half as much as the index. Small caps are weaker than the average stock: IWM is -1.40%. The Dow ETF DIA is -0.29%, with JPMorgan up 1.0%.
| Sector ETF, Fri Oct 16 | Change vs Thu close |
|---|---|
| XLE (Energy) | +1.89% |
| XLU (Utilities) | +1.21% |
| XLP (Staples) | +0.87% |
| XLB (Materials) | +0.85% |
| XLRE (Real estate) | +0.21% |
| XLF (Financials) | +0.20% |
| XLI (Industrials) | -0.01% |
| XLV (Health care) | -0.08% |
| XLY (Consumer discretionary) | -0.55% |
| XLC (Communication services) | -1.30% |
| XLK (Technology) | -2.21% |
| SMH (semiconductors) | -1.92% |
SPDR sector ETFs and SMH, TradingView marks at about 9:57 AM PT / 12:57 PM ET.
The rotation is defensive and energy-led. Energy (XLE +1.89%), utilities (XLU +1.21%), staples (XLP +0.87%) and materials (XLB +0.85%) are the leaders. Technology (XLK -2.21%), communication services (XLC -1.30%) and semiconductors (SMH -1.92%) are the drag. Thursday's pattern was equal weight and small caps up while chips fell, which we covered in the morning note. Today small caps are selling too, which is the part that changed.
Credit is a little softer but not stressed. The high-yield bond ETF HYG is 76.92, -0.28%.
The 10-year yield near 5.1%: bear steepening, not a flight to safety
The 10-year Treasury yield is 5.127%, up 4.8 basis points from Thursday's 5.079% close. The 2-year is 4.774%, up 1.7 basis points from 4.757%. The gap between them is about 35 basis points, against about 32 on Thursday. Long yields rising faster than short yields is a bear steepening, and it is the opposite of what a flight to safety looks like.
Our morning recap had the 2-year barely moving at 4.761% and the 10-year at 5.110%. Since then the 2-year is up 1.3 basis points and the 10-year is up 1.7. Any read of flat or lower yields from this morning is stale. Stocks are not getting a bond bid today; they are getting sold with yields higher, which is the harder combination for equity valuations.
Elsewhere, the dollar index is 101.95, -0.05%. $WTI is $98.67, +0.71% versus the prior settle and up from a low of 95.29, which fits the bid in energy stocks. Gold is $4,160.32, -0.26%. Bitcoin (Bitstamp) is $81,311, -1.00%, so crypto is not the source of today's stress.
Software stocks selloff and cybersecurity stocks: Palo Alto, Fortinet, CrowdStrike
| Stock, Fri Oct 16 | Last | Change vs Thu close | Catalyst, as sourced |
|---|---|---|---|
| TWLO (Twilio) | 242.23 | -11.40% | Leads software lower; no single catalyst confirmed |
| MRNA (Moderna) | 213.57 | -9.70% | Falls ahead of cancer vaccine data next week (Seeking Alpha) |
| MSTR (Strategy) | 137.41 | -9.17% | Potential removal from MSCI indexes under new rules (Reuters, Dow Jones) |
| SMCI | 32.00 | -8.82% | AI infrastructure drag, no company-specific catalyst confirmed |
| FTNT (Fortinet) | 167.62 | -7.86% | Cyber group selloff (TradingKey) |
| PANW (Palo Alto Networks) | 341.76 | -7.70% | Exploited PAN-OS zero-day CVE-2026-0322 (Investing.com, CISA) |
| CRWD (CrowdStrike) | 226.97 | -7.20% | Cyber group selloff (TradingKey) |
| DDOG (Datadog) | 247.32 | -7.11% | Software selloff, no company-specific catalyst confirmed |
| PLTR (Palantir) | 186.66 | -6.91% | Software selloff, no company-specific catalyst confirmed |
| COHR (Coherent) | 235.96 | -5.84% | AI infrastructure drag, no company-specific catalyst confirmed |
TradingView marks at about 9:57 AM PT / 12:57 PM ET; catalysts from headlines via TradingView news and the sources named. Where we have no sourced catalyst we say so.
Software and cybersecurity are the sharpest part of the tape. Twilio (-11.40%) leads software lower. Datadog is -7.11% and Palantir is -6.91%. We do not have a verified single catalyst for the software move and will not invent one.
Cybersecurity has two stories. Palo Alto Networks (-7.70%) is dealing with an actively exploited zero-day in PAN-OS, tracked as CVE-2026-0322 with a CVSS score of 8.6. CISA added it to its Known Exploited Vulnerabilities catalog with a federal remediation deadline of Oct 17 (Investing.com). For the group, Fortinet (-7.86%) and CrowdStrike (-7.20%) are down on profit-taking from record highs and on reports that large AI developers are pushing into vulnerability detection, per TradingKey. That is a competitive-threat narrative, and it is a headline we cannot size.
Chips and megacaps share the drag. Investing.com ties the chip weakness to scrutiny of AI infrastructure spending and its financing costs. Broadcom is -3.08%, AMD is -3.74%, Micron is -3.76%, Oracle is -3.64%, and SMH is -1.92%. Meta is -2.72%, Microsoft is -2.17%, Alphabet is -2.01%, Tesla is -2.12% and Amazon is -1.45%. Nvidia is only -0.51%, and Apple is +0.78% at $344.67, the standout green megacap.
MicroStrategy and MSCI: Strategy faces index-removal risk
Strategy (MSTR, the company formerly known as MicroStrategy) is -9.17% at $137.41. Reuters and Dow Jones report that the company faces potential removal from MSCI indexes under new rules, which would put billions of dollars of passive holdings at risk. Strategy called the rules discriminatory, per Stocktwits. Bitcoin is only -1.00%, so this is index-flow risk, not a bitcoin crash.
Moderna falls ahead of cancer vaccine data
Moderna (MRNA) is -9.70% at $213.57. Seeking Alpha's headline says it is falling ahead of cancer vaccine data expected next week, after the stock hit 52-week highs on Thursday.
On the other side, energy and gas names lead the S&P 500, with HONA, EXE, EQT, APA and KMI each up roughly 3% on the TradingView screener at about 9:50 AM PT, with $WTI near $98.5.
Hot inflation data, yet hike odds fall: what Polymarket sees
Industrial production rose 0.7% in September against a 0.4% forecast, after 0.1% in August. That is a second data surprise on the strong side today, after the import and export prices in our morning recap. Thursday's producer prices (+1.3% against 0.5%, core +0.7% against 0.3%, 6.3% over 12 months against 5.3%) were hotter still, as we covered in the PPI morning note.
| Fri Oct 16 data (Sept) | Actual | Forecast | Prior |
|---|---|---|---|
| Industrial production m/m | +0.7% | 0.4% | 0.1% |
| Import prices m/m | +1.1% | 0.8% | 0.5% |
| Export prices m/m | +2.2% | 1.0% | 1.2% |
TradingView economic calendar. Import and export prices are covered in our morning recap; the industrial production prior is as listed on the calendar now.
The odd part is the pricing. Polymarket puts an October 25 basis point hike at 12.5%, with no change at 86.5%, as of 9:57 AM PT. That is down about 15 points in a day: it was roughly 27.5% into Fed Chair Kevin Warsh's Thursday 8:30 PM PT appearance and 16.5% by 9 PM PT. December is 77.5% for a hike and 18.5% for no change. The morning recap had October at 13.5% and December at 78.5%, so the move since is one point lower in each. In plain terms, prediction markets now price October as roughly a 1-in-8 hike chance even though wholesale and import inflation keep running hot. We explain how we read these odds in our hike odds note.
That is the tension for stocks today. If inflation is hot and the Fed is seen as patient on October, the yield on the 10-year is where the pressure goes. It is 5.127%. Our overnight Warsh note is the framework: patience on timing, not a change of direction.
Options expiration October 16: what to watch this afternoon
- Fri Oct 16, 11:00 AM PT (2:00 PM ET): monthly budget statement (forecast -$29B, prior -$167B).
- Fri Oct 16, 1:00 PM PT (4:00 PM ET): the close and monthly options expiration settlement, plus TIC long-term flows for August (forecast $75.2B, prior -$27.9B). For the mechanics of expiration days, see our explainers on positive versus negative gamma and gamma exposure.
- Fri Oct 16, 3:00 PM PT (6:00 PM ET): Fed's Goolsbee speaks.
- Mon Oct 19: NAHB housing index at 7:00 AM PT (forecast 31).
- Tue Oct 20: housing starts (forecast 1.30M) and permits (1.40M) at 5:30 AM PT, pending home sales at 7:00 AM PT. Netflix reports after the close.
- Wed Oct 21: EIA crude inventories at 7:30 AM PT, Kinder Morgan (KMI) earnings, and Tesla reports after the close.
- Thu Oct 22: jobless claims at 5:30 AM PT (forecast 200k).
- Fri Oct 23: S&P flash PMIs at 6:45 AM PT (manufacturing 55.6, services 57.9) and final University of Michigan sentiment at 7:00 AM PT (46.3).
- Next week, per Seeking Alpha: Moderna's cancer vaccine data. FOMC meets Oct 27-28.
Three ways the afternoon can go
- QQQ holds the 715 area and SPY holds Thursday's 764.43 low: the selloff stays a tech and software event, the equal-weight index keeps outperforming, and the VIX gives some of its jump back into the close.
- QQQ closes decisively under Thursday's 715.44 low: the weekly loss becomes a lower-low story, and the question moves to whether SPY follows under 764.43 and whether RSP, now -0.34%, stops absorbing the pressure.
- The 10-year pushes further above 5.13% into the close: the bear steepening spreads from bonds to a broader equity de-rating, and the defensive and energy bid is tested.
We do not know which of these wins. We know the questions: does the Nasdaq-100 hold Thursday's low through the expiration close, and does the 10-year stop rising.
FAQ
Why is the Nasdaq headed for its first weekly loss in five weeks?
AP and Investing.com both frame this week as a tech-led selloff that has the Nasdaq on track for its first weekly loss in five weeks. Selling is concentrated in AI chips, software and cybersecurity stocks. QQQ is -1.76% at 715.20 as of about 9:57 AM PT, sitting on Thursday's low of 715.44, and SMH is -1.92%. Investing.com ties the chip weakness to scrutiny of AI infrastructure spending and financing costs.
Why is the S&P 500 down when half its stocks are up?
Because the index is cap-weighted. 255 of 503 S&P 500 stocks are up, but several of the largest tech names, including Meta, Microsoft, Alphabet and Broadcom, are down 2% to 4%, so SPY is -0.76%. The equal-weight S&P 500 (RSP) is only -0.34%. Energy, utilities and staples are green.
Why are Palo Alto, Fortinet and CrowdStrike falling today?
Palo Alto Networks (-7.70%) faces an actively exploited PAN-OS zero-day, CVE-2026-0322, which CISA added to its Known Exploited Vulnerabilities catalog with an Oct 17 federal deadline (Investing.com). Fortinet (-7.86%) and CrowdStrike (-7.20%) are down on profit-taking from record highs and reports that large AI developers are moving into vulnerability detection, per TradingKey.
What does the 10-year yield at 5.1% mean for stocks today?
The 10-year Treasury yield is 5.127%, up 4.8 basis points from Thursday, with the 2-year up 1.7. Long yields rising faster than short yields is a bear steepening. October Fed hike odds are 12.5% and December is 77.5% on Polymarket as of 9:57 AM PT, so the market is not pricing a near-term Fed shock, but it is demanding more yield for holding long bonds.
Follow the desk
Follow @CosAnalyst on X for the read on today's expiration close and next week's data. Join the free Telegram alerts channel, Free Index & BTC Trade Alerts. It posted one signal today, a QQQ long at 7:50 AM PT, and it was stopped out for a 1R loss. We checked the outcome against TradingView 5-minute bars; the channel's own receipt post had not appeared yet when this was published. Showing the losses is part of the plan. Nothing there is financial advice.
BOOK FACT · NOT A TICKET. CosAnalyst research and analysis, not financial advice or a trade recommendation. The first-weekly-loss-in-five-weeks framing is from AP News and Investing.com; the earlier AP snapshot at 11 AM ET showed milder index losses than our live marks. Quotes, ETFs, futures, yields, the dollar index, $WTI, gold, Bitcoin, VIX, sector ETFs and S&P 500 breadth are TradingView marks and screener counts at about 9:57 AM PT / 12:57 PM ET, Fri Oct 16, 2026. Thursday closes are TradingView daily closes. Data actuals, forecasts and priors are from the TradingView economic calendar. Fed odds are from the Polymarket gamma API as of about 9:57 AM PT. Catalysts: Palo Alto Networks CVE-2026-0322 and the CISA catalog listing from Investing.com; Fortinet and CrowdStrike from TradingKey; Strategy and MSCI from Reuters and Dow Jones, with the discriminatory-rules comment from Stocktwits; Moderna from Seeking Alpha; chips from Investing.com. Free-channel outcome checked against TradingView QQQ 5-minute bars. FOMC dates are from federalreserve.gov. Prediction-market odds and market data change quickly, and this page reflects one midday snapshot.