
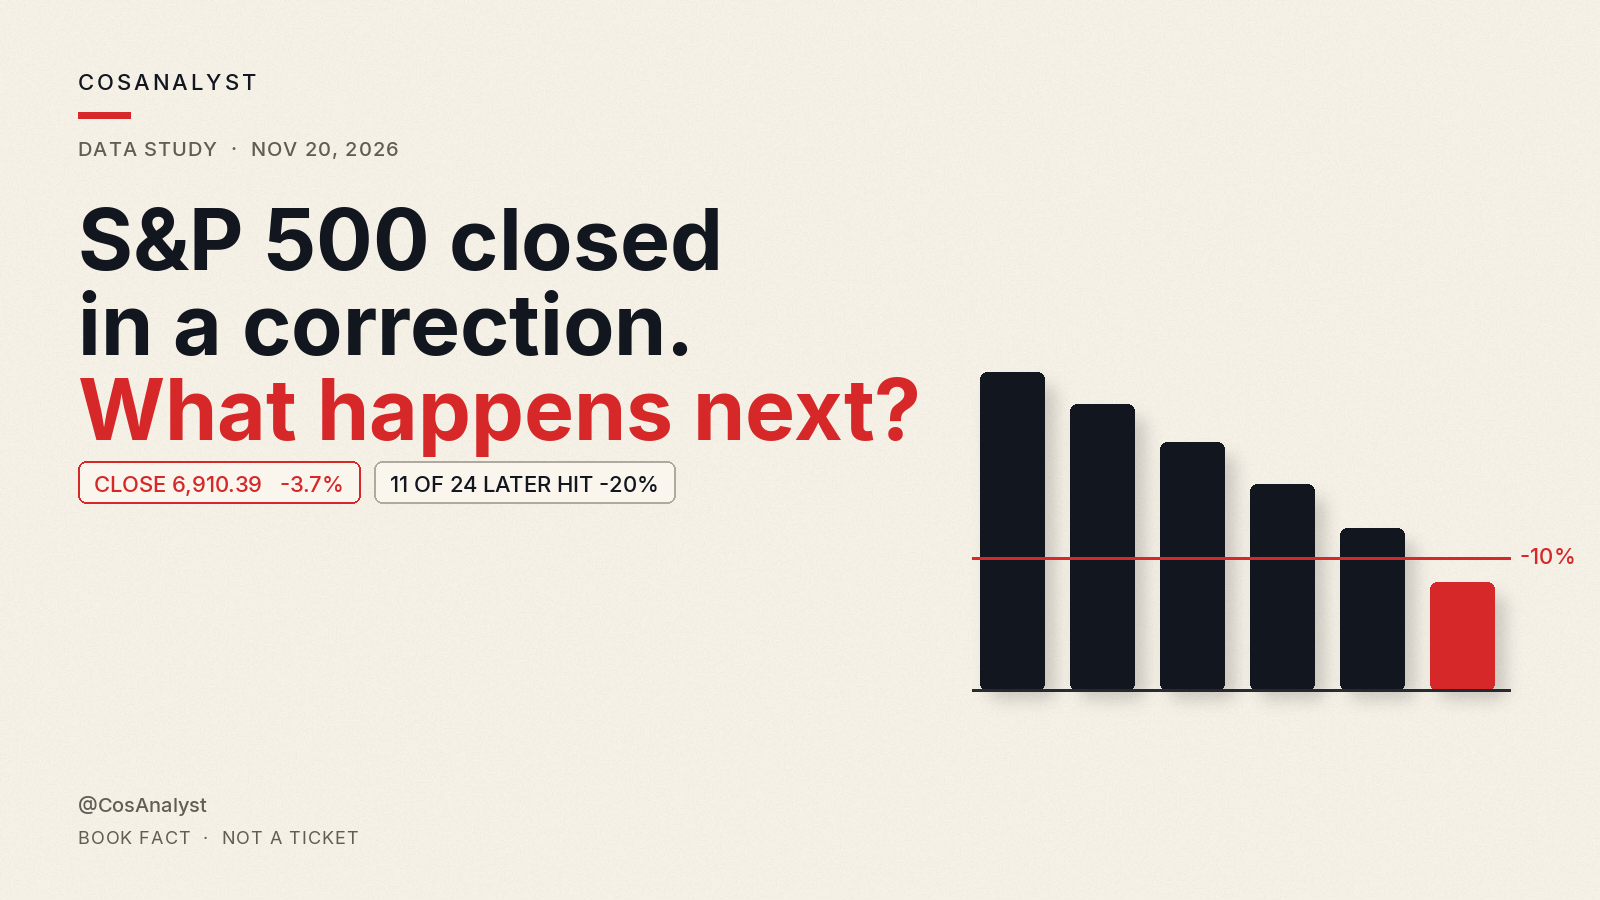
Short answer: the AI selloff ran for a seventh straight session, and the S&P 500 closed in a correction. The index finished at 6,910.39, down 3.7%, which is 11.6% below its Oct. 6 record close of 7,818.93 (CNBC, Yahoo Finance). A correction is a 10% drop from a high. A bear market is 20%. We checked every time since 1950 that the S&P 500 first closed at least 10% below a record. In 11 of the 24 completed cases, a later close fell 20% or more below that same record. A year after the entry close, the median return was +11.4%, close to an ordinary year.
This is the close of the tape we wrote up this morning. The six-day losing streak and the VIX spike set the week up. Bitcoin's break below $60,000 and gold's worst week since March were the other two legs. The chip side still runs through the Nvidia board probe.
Why did the stock market crash today?
The selling was an AI unwind that spread, then got a fresh Nvidia headline into the close. Four facts from the session, each with a source.
1. The Anthropic IPO did not stop the AI selloff. Anthropic closed at $88.91, down 8.5% from Thursday's $97.17 debut close (Yahoo Finance). CNBC put the same drop at 8.5%, giving back a large piece of Thursday's 17% jump, and said the debut led investors to take profits on the AI rally. Massimo Santicchia, head of U.S. equities at Procyon, told CNBC: "This is not just a valuation-driven correction. It's becoming broader." He added, "Right now, it's definitely risk-off" (CNBC).
2. Chips took the hardest hit, and Reuters added an SEC accounting report. Nvidia closed at $125.53, down 14.0%. AMD closed at $424.39, down 13.2%. Micron closed at $594.51, down 13.9% (Yahoo Finance). CNBC had the same trio at around 14%, more than 13%, and almost 14%. CNBC also said Nvidia recorded its longest weekly losing streak since the 2008 financial crisis. Reuters reported that SEC enforcement staff are scrutinizing potential accounting issues at Nvidia, according to two people briefed on the matter. The SEC declined to comment. Nvidia did not immediately respond. Reuters said the shares were down about 13% after the story, and had been down more than 6% before it. An investigation is not evidence of wrongdoing, and many close without an enforcement action (Reuters).
3. The week was already broken before Friday. From last Friday's close to this one, the S&P 500 fell 8.6%, the Dow fell 8.0%, and the Nasdaq Composite fell 10.0% (Yahoo Finance). CNBC called the S&P week its worst since April 2025, the Dow's worst week since March 2020, and the Nasdaq's largest one-week pullback in more than six years. AP called the S&P weekly loss the worst in more than 18 months (AP). Benedicte Lowe, an equity derivatives strategist at BNP Paribas, told CNBC that investors were "panic selling" as they try to gauge whether AI sentiment has peaked (CNBC, Fortune).
4. The Fed is still priced to hike, and buyers still showed up for Treasuries. On Polymarket at 2:13 PM PT, a 25 basis point hike at the Dec. 8 to 9 meeting was 89.5 cents, with the last trade at 90 cents. No change was 8.65 cents. A hike of 50 basis points or more was about 1.9 cents. Either size of cut was under 1% (Polymarket). Our December Fed odds hub tracks that market. The 10-year yield closed at 4.91%, down 14 basis points from Thursday's 5.05% (Yahoo Finance ^TNX). Stocks fell and the bond yield fell with them.
Is the S&P 500 in a correction?
Yes, on the standard closing definition. Thursday's close of 7,175.83 was 8.2% below the Oct. 6 record of 7,818.93, short of 10%. Friday's 6,910.39 is 11.6% below that record. The 10% line on this series is a close at or below about 7,037. CNBC said the S&P 500 and the Dow both closed 10% or more below their record closes. On Yahoo Finance ^DJI, the Dow's record close is Aug. 5, 2026, at 54,349.12. Friday's 48,147.33 finish is 11.4% below that, a drop of 949.73 points, or 1.93%, from Thursday.
Friday was also the seventh straight down close for the S&P 500. On the same Yahoo series, the previous streak of seven or more down days ended Feb. 28, 2020. Fortune reported the same milestone: a seventh straight loss, the longest since February 2020. The morning study of those streaks is here: why the stock market is down this week.
Data study: what happened after every new S&P 500 correction since 1950
Method. We used Yahoo Finance daily closes for ^GSPC, the S&P 500 index, from Dec. 30, 1927 through Nov. 20, 2026. The count starts in 1950. The record high uses the full history, so a 1950 reading is measured against the real peak. A new correction is the first close at least 10% below the highest close on record, after a new record close has reset the count. Later days in the same drawdown are not counted again. Forward returns are the price change from that close over 63, 126 and 252 trading days, about three, six and twelve months. No dividends. A case "hit -20%" if some later close, before the next record close, was at least 20% under that same record. Friday is in the table and out of the medians. Price returns only.
| After the entry close | Cases | Higher | Median return |
|---|---|---|---|
| 3 months (63 trading days) | 24 | 15 of 24 | +2.54% |
| 6 months (126 trading days) | 24 | 17 of 24 | +5.70% |
| 12 months (252 trading days) | 24 | 16 of 24 | +11.41% |
| Any day, 12 months (baseline) | all | 75% up | +10.67% |
Median of the unrounded price returns. The current correction has no forward data. Baseline is every trading day since 1950 with a full year ahead, same series. Source: Yahoo Finance ^GSPC, CosAnalyst calculation on Nov. 20, 2026.
| First close | S&P close | Below record | 3 months | 6 months | 12 months | Hit -20% |
|---|---|---|---|---|---|---|
| Oct. 11, 1955 | 41 | -10.6% | +9.7% | +17.7% | +14.8% | No |
| Nov. 21, 1956 | 45 | -10.0% | -2.9% | +5.7% | -8.5% | Yes |
| Mar. 4, 1960 | 55 | -10.1% | +3.0% | +4.6% | +17.4% | No |
| Apr. 30, 1962 | 65 | -10.2% | -11.4% | -16.4% | +7.0% | Yes |
| May 16, 1966 | 84 | -10.3% | -2.0% | -3.6% | +10.3% | Yes |
| Mar. 5, 1968 | 88 | -10.1% | +13.9% | +17.0% | +15.7% | No |
| Jun. 19, 1969 | 97 | -10.3% | -2.1% | -6.8% | -21.3% | Yes |
| Apr. 27, 1973 | 107 | -10.8% | +2.2% | +3.0% | -15.9% | Yes |
| Aug. 24, 1981 | 126 | -10.7% | -3.0% | -11.1% | -7.5% | Yes |
| Feb. 13, 1984 | 155 | -10.3% | +1.6% | +6.8% | +16.5% | No |
| Oct. 15, 1987 | 298 | -11.5% | -15.4% | -12.9% | -7.7% | Yes |
| Jan. 30, 1990 | 323 | -10.2% | +2.9% | +10.3% | +4.0% | No |
| Aug. 17, 1990 | 328 | -11.1% | -3.3% | +12.6% | +17.6% | No |
| Oct. 27, 1997 | 877 | -10.8% | +11.5% | +24.8% | +21.5% | No |
| Aug. 14, 1998 | 1,063 | -10.4% | +5.2% | +16.9% | +25.2% | No |
| Sept. 29, 1999 | 1,268 | -10.6% | +15.4% | +18.9% | +12.5% | No |
| Apr. 14, 2000 | 1,357 | -11.2% | +11.3% | +1.3% | -12.1% | Yes |
| Nov. 26, 2007 | 1,407 | -10.1% | -1.9% | -1.2% | -39.5% | Yes |
| Aug. 24, 2015 | 1,893 | -11.2% | +10.4% | +1.9% | +15.5% | No |
| Feb. 8, 2018 | 2,581 | -10.2% | +5.5% | +10.6% | +5.0% | No |
| Nov. 23, 2018 | 2,633 | -10.2% | +6.1% | +5.7% | +19.0% | No |
| Feb. 27, 2020 | 2,979 | -12.0% | +1.7% | +16.8% | +27.9% | Yes |
| Feb. 22, 2022 | 4,305 | -10.3% | -7.7% | -4.1% | -6.8% | Yes |
| Mar. 13, 2025 | 5,522 | -10.1% | +9.5% | +19.2% | +21.3% | No |
| Nov. 20, 2026 | 6,910 | -11.6% | n/a | n/a | n/a | n/a |
Closes rounded to the dollar. Returns and the drawdown are rounded to one decimal from the unrounded Yahoo series. Hit -20% means a later close, before the next record, was at least 20% under the record that defined that correction. Nov. 20, 2026 is the live case.
What the numbers say:
- A new correction has been uncommon. Twenty-four completed cases since 1950, plus today. The previous one was March 13, 2025. That drawdown reached -18.9% and never closed 20% under its record. A year later the S&P 500 was up 21.3% from the entry close.
- The year-later result looks like a normal year. The median return 252 trading days later was +11.41%, and 16 of 24 cases were higher. A random day since 1950 was higher a year later about 75% of the time, with a median gain of +10.67%. The correction entry did not, by itself, mark a better or worse year than average.
- Three and six months were ordinary too. The three-month median was +2.54% (15 of 24 higher), against a +2.72% baseline. The six-month median was +5.70% (17 of 24 higher), against +5.16%.
- The part that stands out is the left tail. In 11 of 24 cases, the index later closed at least 20% below the same record before it made a new high. The median worst close in those 24 drawdowns was about -19.8%. Several that missed the 20% line still got close: August 1990 reached -19.9%, November 2018 reached -19.8%, and March 2025 reached -18.9%.
- The bad case and the rebound case are both in the table. After Nov. 26, 2007, the S&P 500 was down 39.5% a year later, and the drawdown eventually reached -56.8%. After Feb. 27, 2020, the drawdown reached -33.9%, and the index was still up 27.9% a year after the entry close.
History is a base rate, not a forecast. Twenty-four cases across very different eras. None of them lines up one for one with an AI unwind, a record IPO, and a Fed already priced to hike.
What happens after the S&P 500 falls 3.5% in one day?
Friday's drop also clears a second line. The close was 3.70% below Thursday on the unrounded Yahoo series, so it joins every day since 1950 the S&P 500 fell 3.5% or more. There are 82 completed days, from 1950 through Nov. 5, 2026. Friday is the 83rd and has no forward path yet. Nov. 5 has a week of trading days after it and does not yet have a month, which is why the one-week count is 82 and the longer counts are 81.
| After the down day | Days with data | Higher | Median return |
|---|---|---|---|
| 1 week (5 trading days) | 82 | 46 of 82 | +0.67% |
| 1 month (21 trading days) | 81 | 52 of 81 | +1.80% |
| 3 months (63 trading days) | 81 | 60 of 81 | +6.44% |
| 12 months (252 trading days) | 81 | 67 of 81 | +21.73% |
Median of the unrounded price returns from the down day's close. Friday is excluded. Source: Yahoo Finance ^GSPC, CosAnalyst calculation on Nov. 20, 2026.
These days bunch together, so 82 is not 82 separate events. Seventeen of them were in 2008 and eleven were in 2020. If we keep only the first 3.5% day in a cluster and skip another one for the next 21 trading days, the sample falls to 44 episodes. A year later, 35 of the 43 episodes with a full year of data were higher, with a median gain of +16.7%. The direction is the same. The +21.7% figure was lifted by counting 2008 and 2020 more than once. A week later, the full sample was higher 46 of 82 times. That is close to a coin flip, and close to the 57% of all days since 1950 that were higher a week later.
One ranking, from the same series, because a 3.7% day invites a "worst since" label. April 4, 2025 fell 5.97%, from 5,396.52 to 5,074.08. Since that session, the largest one-day drop was Nov. 5, 2026, down 4.36% to 7,353.73. Friday, at 3.70%, is next. The April 10, 2025 drop was 3.46%, just short of the 3.5% line used above.
Is the Nasdaq in a bear market?
The Nasdaq-100 traded through that line and did not close through it. It finished at 25,028.98, down 5.6% on the day (Yahoo Finance ^NDX). CNBC said it fell 5.6% and entered a bear market on an intraday basis, 20% off its recent high. On the Yahoo series the Oct. 6 record close is 31,224.47. Friday's low of 24,910.48 was 20.2% below that record. The close was 19.8% below it, about 49 points above the 20% line near 24,980.
The Nasdaq Composite closed at 22,617.73, down 5.28%, and is down 2.7% for 2026 versus the Dec. 31, 2025 close of 23,241.99 (Yahoo Finance, and CNBC's year-to-date figure). It is 18.1% below its own Oct. 6 record close of 27,599.79. That is a correction. A closing bear market on the Composite would be a finish at or below about 22,080. It closed above that line.
The VIX closed at 35.89, up from 28.44 on Thursday, with a high of 40.03 (Yahoo Finance ^VIX). The previous close above 30 was March 30, 2026, at 30.61. March 27 also closed above 30, at 31.05. CNBC's live blog caught the index at 32.27 while the session was still going. The close is the 35.89 print.
Markets at the Friday close
| Market | Ticker | Close | Move |
|---|---|---|---|
| S&P 500 | SPX | 6,910.39 | -3.7% (seventh straight loss) |
| Dow Jones | DJI | 48,147.33 | -949.73, or -1.93% |
| Nasdaq Composite | IXIC | 22,617.73 | -5.28%, and -2.7% for 2026 |
| Nasdaq-100 | NDX | 25,028.98 | -5.6%; low was 20.2% off the record |
| VIX | VIX | 35.89 | First close above 30 since March 30 |
| Nvidia | NVDA | $125.53 | -14.0% |
| AMD | AMD | $424.39 | -13.2% |
| Micron | MU | $594.51 | -13.9% |
| Anthropic | ANT | $88.91 | -8.5% |
| 10-year yield | US10Y | 4.91% | Down 14 bps from 5.05% |
Index, chip, Anthropic and yield closes: Yahoo Finance, Nov. 20, 2026. The S&P, Dow and Nasdaq Composite closes, and the Dow's point drop, match CNBC. Intraday prices moved all day. These are closes.
What to watch next: if/then
- If the S&P 500 closes back above about 7,037, it would leave correction territory on a closing basis. That line is 10% below the Oct. 6 record of 7,818.93.
- If it closes at or below about 6,255, the S&P 500 itself would be in a bear market, 20% below that same record. In 11 of 24 past corrections, a later close got there before a new high.
- If the Nasdaq-100 closes at or below about 24,980, it would join the bear-market side on a close, not only on a low. Friday's close was 25,028.98. The low was 24,910.48.
- If the Dow closes back above about 48,914, it would be back within 10% of its Aug. 5 record close of 54,349.12. Friday finished at 48,147.33.
- If the VIX's next close is back under 30, Friday's 35.89 would stand as a one-day close above the line, the first since March 30.
- If Polymarket's December 25 bp hike price falls from 89.5 cents, one of the weights on stocks is lighter. The Fed odds hub is where that price gets updated.
FAQ
Why did the stock market crash today?
An AI selloff deepened for a seventh straight session on Nov. 20, 2026. Anthropic fell 8.5% in its second day of trading, Nvidia fell 14.0% after Reuters reported an SEC look at potential accounting issues, and the S&P 500 closed at 6,910.39, down 3.7%. The SEC probe does not establish wrongdoing. Sources: CNBC, Reuters, Yahoo Finance.
Is the S&P 500 in a correction?
Yes. A correction is a drop of 10% or more from a high. The S&P 500's Oct. 6, 2026 record close was 7,818.93. Friday's close of 6,910.39 is 11.6% below that. Thursday, at 7,175.83, was still 8.2% below the record. The Dow also closed more than 10% below its record.
Is the stock market going to crash?
Nobody knows. The S&P 500 is 11.6% below its record. A closing bear market, 20% below that record, would be a finish at or below about 6,255. In 11 of 24 new corrections since 1950, a later close did reach 20% below the record that started the count. In the other 13, it did not. A year after those entry closes, the median return was +11.4%. That is a base rate from past prices, not a forecast.
Is the Nasdaq in a bear market?
The Nasdaq-100's low on Nov. 20 was 20.2% below its Oct. 6 record close, which is a bear-market distance on an intraday basis. The close was 19.8% below that record, at 25,028.98. The Nasdaq Composite closed 18.1% below its record and is down 2.7% for 2026. A Composite close at or below about 22,080 would be 20% off its record. It closed at 22,617.73.
What happens after a new S&P 500 correction?
In the 24 completed cases since 1950, the median S&P 500 price return was +2.54% after 63 trading days (15 of 24 higher), +5.70% after 126 trading days (17 of 24 higher) and +11.41% after 252 trading days (16 of 24 higher). Eleven of the 24 later closed at least 20% below the same record. Price returns only, Yahoo Finance ^GSPC, computed by CosAnalyst.
What happens after the S&P 500 falls 3.5% in a day?
In 82 completed days since 1950, the median return a week later was +0.67% (46 of 82 higher). A month later, using the 81 days that have a full month, the median was +1.80% (52 of 81 higher). A year later the median was +21.73% (67 of 81 higher). Those days cluster, including 17 in 2008 and 11 in 2020, so the year-later median counts some crashes more than once. Price returns, Yahoo Finance ^GSPC, computed by CosAnalyst.
Will the Fed cut rates to stop the selloff?
Prediction markets were pricing a hike on Friday afternoon, not a cut. On Polymarket at 2:13 PM PT, a 25 basis point increase at the Dec. 8 to 9 meeting was 89.5 cents, no change was 8.65 cents, and any cut was under 1%. That price can change. See the December Fed odds hub for later reads.
Not financial advice. Historical returns are price-only S&P 500 returns computed from public daily closes. They do not predict future results. A correction and a bear market are labels for how far a close sits from a record. They are not forecasts. Closes are from the Nov. 20, 2026 session. Nothing here guarantees any market outcome.
Follow @CosAnalyst on X, like the CosAnalyst Facebook Page for plain-English market notes, and join our Telegram at @CosAnalystSignals.
Your call: Is this one of the 11 corrections that later closed 20% under the record, or one of the 13 that bottomed above that line? Pick a side in the comments.