
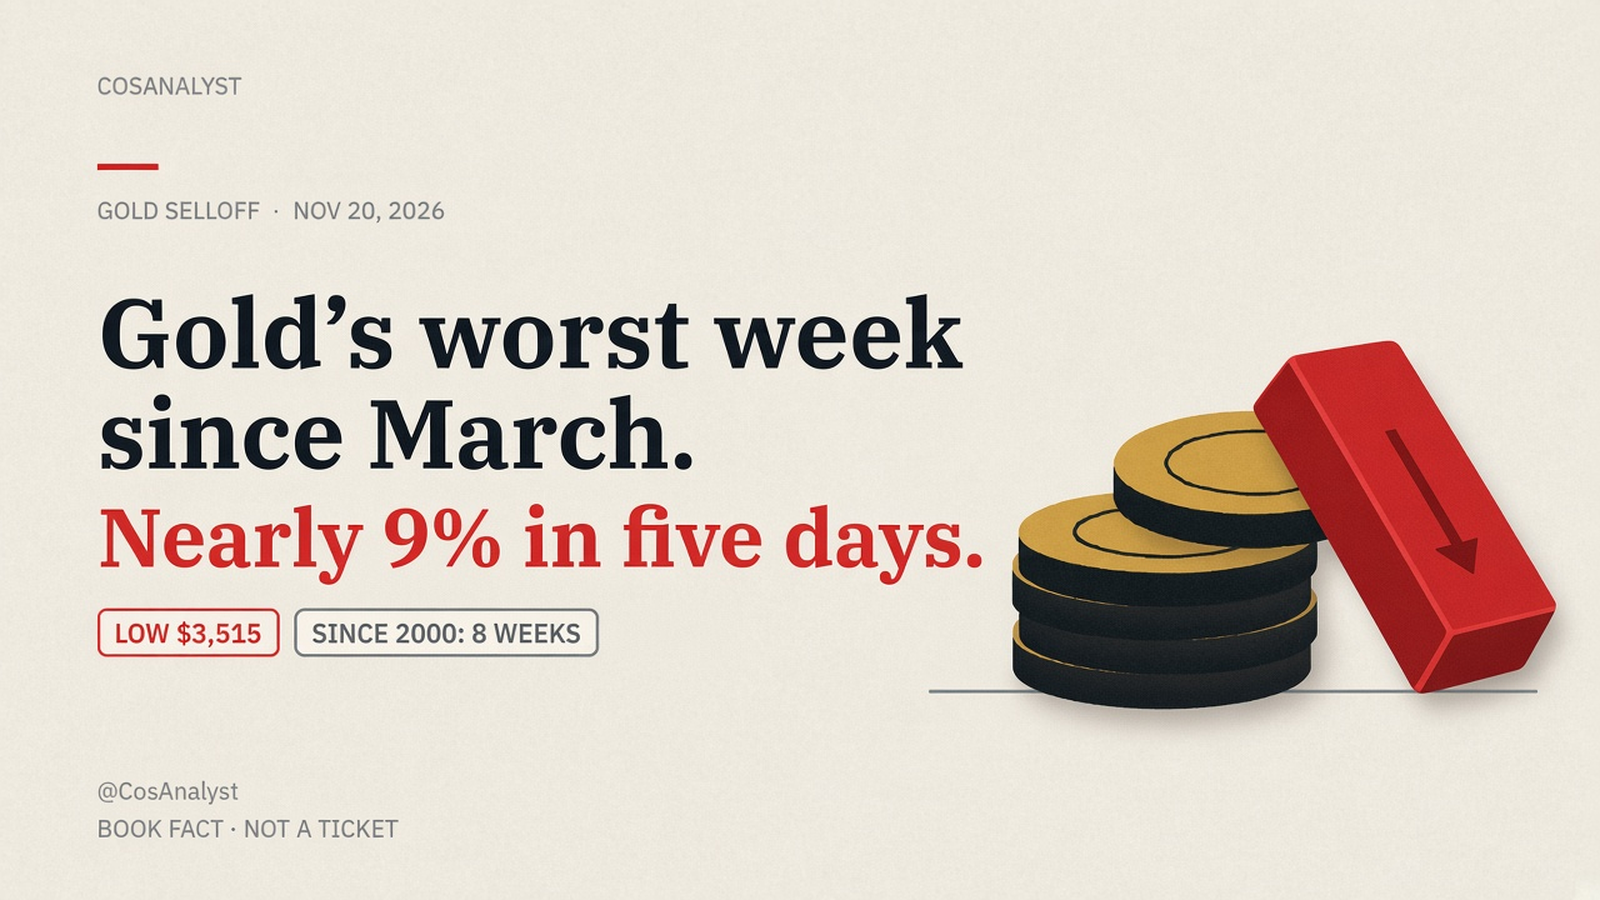
Short answer: a hawkish Fed, higher real yields and a firmer dollar raised the cost of holding a metal that pays nothing, and some holders sold gold to cover losses in the AI stock selloff. Spot gold touched $3,513.54, which Reuters called the lowest since Sept. 4, 2025, and the same story put the week at about 8% as of a 6:04 AM ET update (CNBC). The selloff kept going. By 9:23 AM PT, COMEX December gold was $3,528.80, down 4.3% on the day (CNBC quote), and 9.2% below last Friday's futures close. That is the worst week since the one ending March 20, and the week is not over. We checked every week since August 2000 that gold futures fell 7.5% or more. A month later was a coin flip. A year later, in a very small and lopsided sample, gold was higher every time.
This is the same tape that hit stocks and bitcoin this morning. The S&P 500 losing streak and bitcoin's break below $60,000 are the other two legs. Three weeks ago gold itself was the story, when it broke below $4,000. It has not found a floor since.
Why is gold down today?
1. The Fed is priced to hike, and gold pays no interest. Philadelphia Fed President Anna Paulson flagged inflation risks that could warrant another rate increase, and Reuters said that is what sped the selloff up (CNBC). Bloomberg, via The Straits Times, added that Chicago Fed President Austan Goolsbee said on Nov. 19 he would consider all options against stubborn inflation. On Polymarket, a 25 basis point hike at the Dec. 8 to 9 meeting was priced at 89.5 cents at 9:29 AM PT, with the last trade at 89 cents. No change was about 7.5 cents. A hike of 50 basis points or more was about 2 cents. Either size of cut was under 1% (Polymarket). Our December Fed odds hub tracks that market.
2. Real yields and the dollar both work against a bar of metal. Critical Metals CEO Tony Sage told Reuters: "Gold is under renewed pressure from hawkish Fed expectations, which are lifting real yields and the US dollar and raising the opportunity cost of holding a non-yielding asset." CoinDesk put numbers on the real-rate side from ING: two-year real rates, swap rates minus the zero-coupon inflation swap, were pushing above 2.40%, the highest since 2023. The same piece said Robin Brooks of the Brookings Institution has 10-year and 30-year real yields at their highest in more than two decades. CoinDesk also had the dollar index near 103.80, up 2.5% for the quarter and at its highest since April 2025. At 9:33 AM PT the ICE dollar index was 103.77, down 0.1% on the day (CNBC), so the week-long dollar bid matters more than this morning's wiggle. The 10-year Treasury yield was 4.94%, down from 5.05% on Thursday (Yahoo Finance).
3. Some of the selling is people raising cash for the stock crash. The second half of Sage's comment is the link to equities: "The ongoing AI-related equity sell-off is also prompting some forced liquidations of gold positions to cover losses elsewhere" (CNBC). Bloomberg's version is the same idea without a named seller: the AI rout "pushed investors to sell the metal to cover losses" (The Straits Times). Gold fell as much as 3.1% on the day in that account, to below $3,515, and was on track to lose nearly 9% on the week. Mining.com.au had spot gold down 2.5% at about $3,536 as of 11:00 AM ET, after a drop of as much as 3% toward $3,500, with futures as low as about $3,514.
There is a real argument on the other side of the flow story. Daniel Ghali, Deutsche Bank's head of metals strategy, wrote that he sees "remarkably limited evidence of large-scale outflows in gold" and called the move a "liquidity vacuum," with "limited observable flows feeding the steep price action," in a note cited by Bloomberg and reported by Mining.com.au. That account says gold ETF holdings have generally risen since the summer, and that Comex speculators have not aggressively cut bullish bets. Reuters also said physical buyers in India and China showed up for the lower price (CNBC). Forced selling and a buyers' strike can both be true. One is people hitting bids. The other is nobody standing there to take them.
Silver is taking the harder hit, which fits a move driven by yields rather than a rush into safety. Kitco's morning report had spot silver at $41.65, down 2.6%, after a low of $40.99, back under $42 (Kitco). Bloomberg said silver has fallen around 14% over the same week, and had it at $41.88, down 2.5% on the day, in the Singapore afternoon (The Straits Times). COMEX silver futures were $41.03 at 9:23 AM PT (Yahoo Finance). That is a futures last, not a second opinion on the 14% spot week.
Data study: what gold did after a 7.5% down week
Method. We used Yahoo Finance daily bars for GC=F, the COMEX gold futures front month, from the first bar on Aug. 30, 2000 through the Nov. 20, 2026 session. A week is the last close of each Monday-to-Friday trading week versus the prior week's last close. Friday is that close when the market is open. We kept every week that fell 7.5% or more, then measured the futures price return 21, 63 and 252 trading days later (about one month, three months and one year). Price returns only. This is not a back-adjusted continuous contract, so a roll can leave a small gap that is not a real move. We looked at the daily path of each qualifying week. The drops were spread across several sessions, not a one-day gap. Today's bar is still the live session, not a settlement, so this week is shown below and left out of the forward stats.
| After the down week | Weeks with data | Higher | Median return |
|---|---|---|---|
| 1 month (21 trading days) | 8 | 4 of 8 | +0.2% |
| 3 months (63 trading days) | 8 | 3 of 8 | -1.8% |
| 12 months (252 trading days) | 7 | 7 of 7 | +14.1% |
Completed weeks only. The current week has no forward data, and the March 20, 2026 week does not have a full year yet. Median of the unrounded price returns. Source: Yahoo Finance GC=F, CosAnalyst calculation on Nov. 20, 2026.
| Week ending | Close | That week | 1 month | 3 months | 12 months |
|---|---|---|---|---|---|
| May 19, 2006 | $657 | -7.6% | -12.2% | -4.7% | +0.4% |
| March 20, 2008 | $920 | -7.9% | -0.5% | -1.9% | +3.9% |
| Aug. 15, 2008 | $786 | -8.4% | -1.2% | -10.3% | +18.9% |
| Oct. 17, 2008 | $785 | -8.2% | -5.5% | +8.9% | +34.7% |
| Dec. 5, 2008 | $751 | -8.1% | +12.1% | +19.3% | +55.0% |
| Sept. 23, 2011 | $1,638 | -9.6% | +0.9% | -1.7% | +7.6% |
| March 13, 2020 | $1,516 | -9.3% | +15.9% | +14.6% | +14.1% |
| March 20, 2026 | $4,575 | -9.6% | +3.2% | -8.1% | n/a |
| Nov. 20, 2026 (live) | $3,529 | -9.2% | n/a | n/a | n/a |
Week-ending COMEX gold futures close and the return from that close. Nov. 20, 2026 uses the $3,528.80 last at 9:23 AM PT, not a settlement. Closes rounded to the dollar. Returns rounded to one decimal from the unrounded series. Source: Yahoo Finance GC=F.
What the numbers say:
- These weeks are rare. Eight completed weeks in a bit more than 26 years, plus this one still in progress. Four of the eight were in 2008.
- One month is a coin flip. Gold was higher 21 trading days later in 4 of 8 cases. The median return was +0.2%. The worst next month was -12.2% after May 2006. The best was +15.9% after the March 2020 liquidation week.
- Three months were worse, not better. Only 3 of 8 were higher, and the median was -1.8%. A violent week did not mean the selling was finished. Three months after March 20, 2026, gold was still down 8.1%.
- The year-later result is real and easy to misuse. All 7 cases with a full year of data were higher, with a median gain of +14.1%. The smallest of those was +0.4% after May 2006. Four of the seven weeks were the 2008 cluster, so this is not seven separate trials. A lot of that "7 of 7" is the 2009 recovery counted more than once. March 2026 does not have a year yet.
- April 2013 did not make the list, and that is the method, not a miss. The famous two-day break, April 12 and April 15, was split across two Friday closes. The week ending April 19, 2013 fell 7.0%, from $1,501 to $1,395, just short of the 7.5% line.
- This week has not passed March. The week ending March 20, 2026 fell 9.6%, from $5,061.70 to $4,574.90. This week is -9.2% with Friday's session still open. A close below about $3,513, which is last Friday's $3,886.30 close minus that same 9.6%, would make this the bigger week on this series. The futures low today was $3,515. Reuters' spot low was $3,513.54.
History is a base rate, not a forecast. The 2008 and March 2020 weeks were also forced-selling events, so this morning is not the first time gold got sold to raise cash. None of the old weeks lines up one for one with a Fed already priced to hike and an AI equity selloff on the same day.
Is gold going down?
Nobody knows, and the week is not closed. On our futures series the line that decides "worst since March" versus "worse than March" is a Friday close near $3,513. Justin Lin, a strategist at Global X ETFs, told Bloomberg that gold is "now firmly in an air pocket, with very little technical support until the $3,300 and $3,400 region," and that it "looks very fragile now" (The Straits Times). That is his map. Kitco's technicians had first support at $3,518, which today's $3,515 futures low already tested, then $3,421, with resistance at $3,597 and $3,699 (Kitco).
One check on the "lowest since September" line, because spot and the futures contract are not the same price. Reuters' spot low of $3,513.54 is their claim, dated to Sept. 4, 2025. On the Yahoo GC=F series, today's $3,515 low is the lowest futures low since Sept. 2, 2025, when the contract traded down to $3,506. Close enough to be the same story. Not the same print.
Markets at about 9:30 AM PT Friday
| Market | Ticker | Price | Move |
|---|---|---|---|
| COMEX gold, December | GC | $3,528.80 | -4.3% today (low $3,515) |
| COMEX silver | SI | $41.03 | Under $42; spot week about -14% (Bloomberg) |
| U.S. dollar index | DXY | 103.77 | -0.1% today (CNBC, 9:33 AM PT) |
| 10-year Treasury yield | US10Y | 4.94% | Down 11 bps from Thursday's 5.05% |
| Bitcoin | BTC-USD | $59,120 | About -4.5% today; low about $59,030 |
Gold and the dollar index: CNBC quotes, 9:23 AM PT and 9:33 AM PT. Silver, the 10-year and bitcoin: Yahoo Finance, about 9:18 to 9:33 AM PT. The silver week is Bloomberg's spot figure via The Straits Times, not the futures day change. Intraday prices move fast. This is a snapshot, not a live quote.
Gold levels to watch: if/then
- If December gold closes Friday above about $3,513, the week ending March 20, 2026 stays the bigger weekly drop on the Yahoo GC=F series. This week remains the worst since that one.
- If it closes below about $3,513, this week overtakes March on that same series. The futures low of $3,515 and the Reuters spot low of $3,513.54 already traded on that line.
- If price gets back above about $3,600, near the $3,597 level Kitco marked as first resistance, the morning flush is fading. Kitco's next resistance is $3,699.
- If it breaks $3,421, that is the next downside level on Kitco's map. Lin's $3,300 to $3,400 zone is his, not a target from this desk.
- If Polymarket's December 25 bp hike price falls from 89.5 cents, one of the weights on gold is lighter. The Fed odds hub is the place to watch that.
- If the AI stock selloff stabilizes, the forced-selling channel Sage described has less to feed on. The stock streak and the bitcoin break are the tells.
FAQ
Why is gold down today?
Traders are pricing another Federal Reserve rate hike, which lifts real yields and the dollar and makes a metal that pays no interest less attractive. A selloff in AI stocks has also pushed some investors to sell gold to cover losses, according to Reuters and Bloomberg. Spot gold fell to $3,513.54 on Nov. 20, 2026.
How much is gold down this week?
Reuters put the spot week at about 8% in a story updated at 6:04 AM ET, the most since the week ending March 20. Bloomberg said nearly 9%. On Yahoo Finance GC=F, COMEX gold was down 9.2% from the Nov. 13 close of $3,886.30 to $3,528.80 at 9:23 AM PT. The March 20, 2026 week fell 9.6% on that same series. Friday's session was still open.
Is gold going down?
The week is not over, and a past crash week has not been a reliable one-month signal. After eight completed weeks since 2000 in which gold futures fell at least 7.5%, gold was higher a month later half the time. On this series, a Friday close below about $3,513 would make this a bigger weekly drop than the week ending March 20, 2026. A close above that leaves March as the larger week.
What happened after gold fell 7.5% in a week?
In the eight completed cases from August 2000 through March 2026, the median COMEX gold return was +0.2% after 21 trading days (4 of 8 higher), -1.8% after 63 trading days (3 of 8 higher) and +14.1% after 252 trading days (7 of 7 higher). Four of those weeks were in 2008, so the year-later count is not seven independent events. Price returns only, Yahoo Finance GC=F, computed by CosAnalyst.
Why is silver falling with gold?
Silver is down harder than gold. Kitco had spot silver at $41.65 on the morning of Nov. 20, under $42, with a low of $40.99. Bloomberg said silver has fallen around 14% on the week. Higher real yields pressure metals that pay no income, and silver usually moves more than gold when that happens.
Will the Fed raise rates in December?
Prediction markets were pricing a hike on Friday morning, not a cut. On Polymarket at 9:29 AM PT, a 25 basis point increase at the Dec. 8 to 9 meeting was 89.5 cents, no change was about 7.5 cents, and any cut was under 1%. That price can change. See the December Fed odds hub for later reads.
Not financial advice. Gold and silver can drop fast, and you can lose money. Historical returns are price-only COMEX gold futures returns from public daily data. They do not predict future results. This week's gold figure uses a live Friday session, not a settlement. Prices are a snapshot from about 9:30 AM PT on Nov. 20, 2026. Nothing here guarantees any market outcome.
Follow @CosAnalyst on X, like the CosAnalyst Facebook Page for plain-English market notes, and join our Telegram at @CosAnalystSignals.
Your call: Is a 9% week with the Fed priced to hike the flush, the way March 2020 was, or the middle of the move, the way the 2008 weeks were? Pick a side in the comments.