
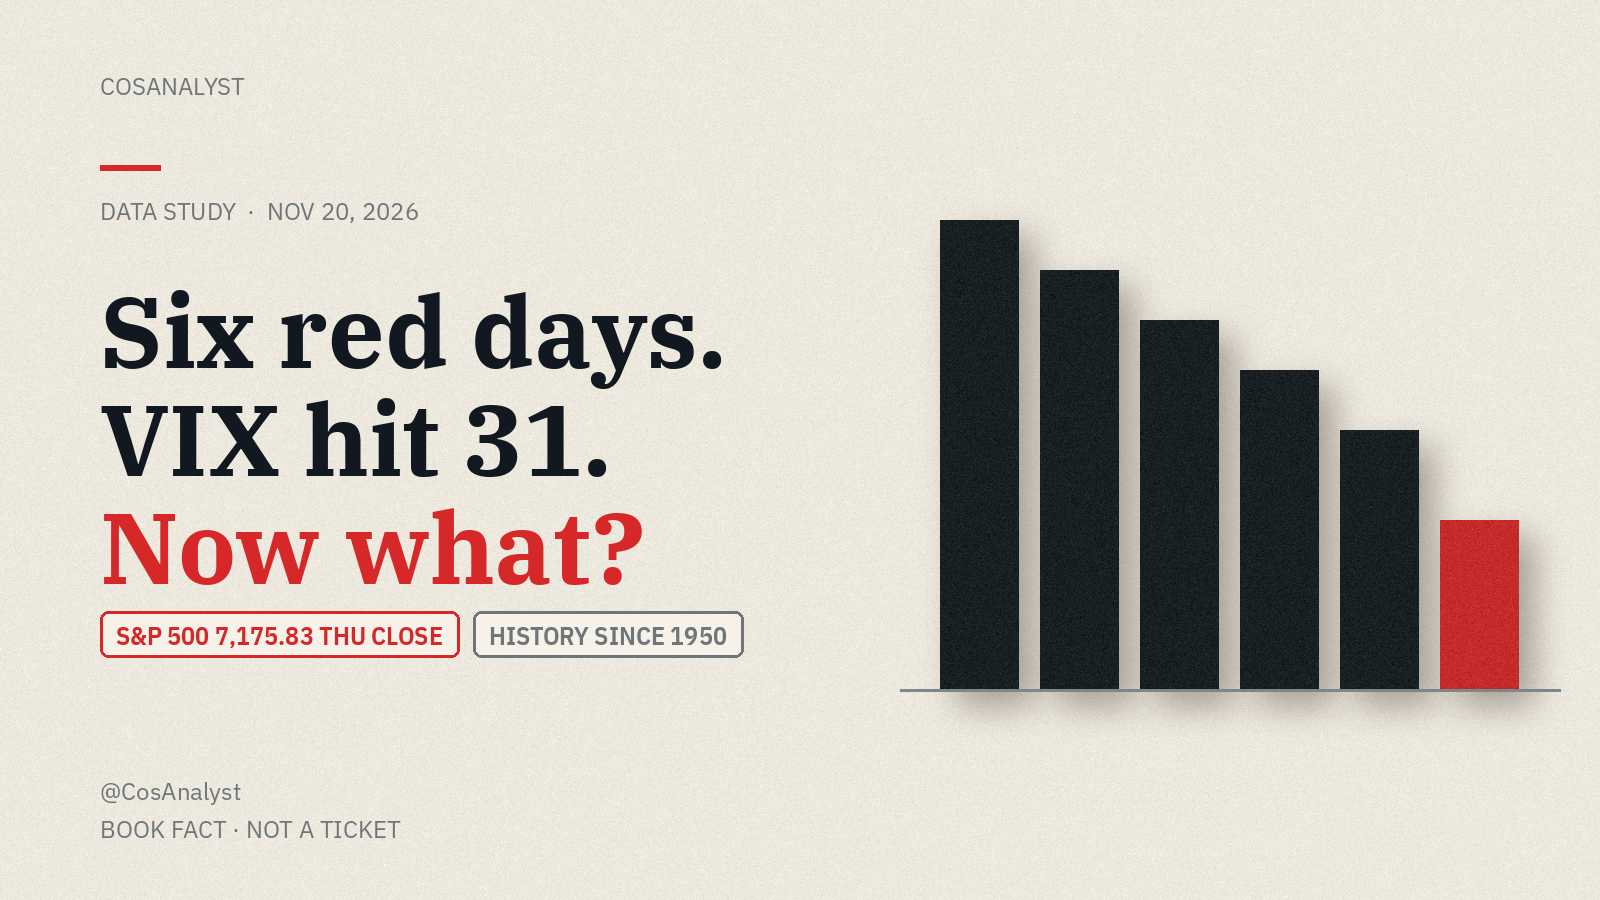
Short answer: the AI trade cracked and took everything else with it. The S&P 500 fell for a sixth straight session on Thursday, closing at 7,175.83. That is its longest losing streak since April 2024 (Deutsche Bank via FXStreet), and a 5.8% drop over those six days (TradingView closes). Anthropic's record IPO was supposed to rescue AI stocks. Instead its shares fell about 9% on Friday morning, Nvidia slid to its lowest since June 2025, and the VIX fear gauge jumped above 31 for the first time since March (CNBC, Investopedia). We ran the history on every S&P 500 losing streak since 1950. The 1-month picture after seven straight down days is a coin flip. The 12-month picture is not.
UPDATE 2:20 PM PT: The correction is confirmed. The S&P 500 closed at 6,910.39, down 3.7%, and the Dow closed at 48,147.33, down 949.73 points, or 1.93%. Both finished more than 10% below their record closes. The Nasdaq Composite closed at 22,617.73, down 5.28%, and is down 2.7% for 2026. Close recap and the history since 1950: [S&P 500 Is in a Correction. What Happens Next?](/articles/sp-500-correction-what-happens-next-2026-11-20/). Sources: CNBC, Yahoo Finance.
UPDATE 10:10 AM PT: The S&P 500 is now trading more than 10% below its Oct. 6 record close, which is correction territory if it holds into the close. It was near 7,028 late morning, down about 2.1% on the day, and the Dow is also more than 10% below its record. The Nasdaq Composite is down about 3.6% today and has turned negative for 2026. Chips are leading the drop: AMD about -11%, Micron about -12% and Nvidia about -7% near $135, a new 52-week low. Anthropic is down about 12% in its second day of trading. Sources: CNBC, AP, Los Angeles Times.
UPDATE 8:20 AM PT, Nov 20
The selloff deepened after the open. The Nasdaq 100 was down about 2.7% and the S&P 500 fell as much as about 1.5% to 7,069.39, below the 7,175.83 level that would make a seventh straight loss (TradingView). The Nasdaq Composite dropped to 23,246.59 at its low, within about 5 points of its 2025 closing level of 23,241.99, nearly erasing its 2026 gain (TradingView, Yahoo Finance). Nvidia fell about 5.7% to near $137.69, and bitcoin broke below $60,000 for the first time since July. Full story: [Why Is Bitcoin Crashing Today? BTC Breaks Below $60,000](/articles/why-is-bitcoin-crashing-today-btc-below-60000-2026-11-20/).
Six weeks ago the S&P 500 and the Nasdaq were sitting at record highs (Investopedia). On Thursday, 464 of the 500 stocks in the index fell, the most decliners of 2026, and even defensive sectors like consumer staples and health care dropped (Deutsche Bank via FXStreet). When the safe stuff goes down with the risky stuff, that is not rotation. That is people selling what they can.
Why is the stock market down this week?
Three things stacked on top of each other: the AI trade lost its leader, the Anthropic IPO did not fix it, and the Fed looks more likely to hike than cut.
1. The AI trade cracked. The selloff started in chips and AI infrastructure and then spread. Concerns about slower data center expansion, higher borrowing costs and the departure of Nvidia CEO Jensen Huang have intensified fears about returns on massive AI spending (Reuters via Investing.com). Traders were also spooked by the Commerce Department closing a loophole that let Chinese companies access Nvidia's AI chips remotely (CNA). Nvidia fell for a sixth straight day Thursday and is down 22% year to date, according to Yahoo Finance (Yahoo Finance). On Friday morning it traded near $141, its lowest level since June 2025 (TradingView). Alphabet, which rose Friday, passed Nvidia in market value, pushing Nvidia to fourth among US companies, according to MSX data cited by Odaily.
2. Anthropic's IPO did not save it. Anthropic (ANT) priced at $83, opened at $111.50 on Thursday after raising $81.3 billion in the largest IPO of all time, then slid all day to close at $97.17. Friday it opened down about 9% (CNBC). "The dam seemed to break once the big event was behind us," Steve Sosnick, chief strategist at Interactive Brokers, told CNBC (via Investopedia). Memory and networking chips took the next hit: Micron was down about 5.6% and Marvell about 4.5% at 7:10 AM PT (TradingView).
3. Asia caught it overnight. Japan's Nikkei 225 fell 5.06% to 56,436.65 with 214 of 225 stocks down (Nikkei Indexes). South Korea's Kospi lost 5.21%, Taiwan's Taiex dropped 6.23%, and SoftBank, one of OpenAI's biggest backers, closed 14.48% lower in its worst session since August 2024 (Market Speaker, CNA).
4. The Fed is not riding to the rescue. Hawkish signals from Fed officials this week weighed on stocks too (Reuters via Investing.com). On Polymarket, traders put the odds of a 25 basis point rate hike at the Dec. 8 to 9 meeting at about 92.5%, with no change at about 3.8% and any cut under 1% (Polymarket, 7:08 AM PT). Our December Fed odds hub tracks that market daily. The 10-year Treasury yield eased to about 4.98% Friday as buyers moved into bonds (TradingView).
One small bright spot: the University of Michigan's final November consumer sentiment reading came in at 51.5, up from 48.0 in October, and year-ahead inflation expectations dropped to 3.7% from 4.7% (University of Michigan). The survey also noted that consumers with the largest stockholdings reported weaker personal finances, consistent with the AI-related turmoil in stocks.
We covered the first leg of this AI selloff on Nov. 6: Why did the stock market crash? Nasdaq, AI and Nvidia. This is the second leg, and it is broader.
What the VIX above 30 means
The VIX is the Cboe Volatility Index. It uses S&P 500 option prices to estimate how much the market expects the index to swing over the next 30 days. Wall Street treats 30 as the line where normal nerves turn into real stress (Investopedia). Friday morning it hit 31.59, up from a 19.30 close the Friday before, and it has closed above 30 only twice this year, both in late March after the Iran war selloff (Investopedia, TradingView).
Here is the twist. By 7:10 AM PT the VIX had already pulled back to about 27.4 and the S&P 500 was roughly flat near 7,179 after falling as much as 0.6% to 7,133.55 at the open (TradingView). Friday is monthly options expiration, and Saxo noted that the one-day volatility gauge jumped above the VIX on Thursday, so the curve slopes down from the front (Saxo). Translation: traders paid up for protection right now, not for months from now.
What happens after the S&P 500 falls 7 days in a row? What history says
We pulled every S&P 500 daily close since January 1950 and counted each losing streak once, on the day it first hit six straight down closes, and again on the day it first hit seven. Then we measured the S&P 500's price return from that close to 5, 21, 63 and 252 trading days later (about 1 week, 1 month, 3 months and 12 months). We did the same for the first VIX close above 30 after at least 60 sessions at or below 30, using VIX history since 1990. Price returns only, no dividends.
| Signal | Times | 1 week | 1 month | 3 months | 12 months |
|---|---|---|---|---|---|
| 6 straight down days | 116 | +0.57% (60% up) | +1.55% (61% up) | +3.63% (70% up) | +12.60% (78% up) |
| 7 straight down days | 46 | +0.12% (52% up) | -0.17% (48% up) | +3.10% (70% up) | +13.65% (78% up) |
| First VIX close above 30 (since 1990) | 22 | +2.06% (73% up) | +3.12% (68% up) | +4.20% (68% up) | +15.14% (67% up) |
| Any day since 1950 (baseline) | all | +0.30% (57% up) | +1.12% (62% up) | +2.72% (67% up) | +10.67% (75% up) |
Median S&P 500 price return after each signal; share of cases that were higher in parentheses. 6-day sample: 116 streaks, 1951 to 2024 (the current streak is the 117th and has no forward data yet). 7-day sample: 46 streaks, 1952 to 2020. VIX sample: 22 cases, 1990 to 2026 (21 with 12-month data). Data: S&P 500 (^GSPC) and VIX (^VIX) daily closes, Yahoo Finance history, last closes cross-checked against TradingView. Computed by CosAnalyst on Nov. 20, 2026.
What the numbers say:
- Six down days has not been a sell signal. After 116 six-day streaks, the S&P 500 was higher a month later 61% of the time, about the same as any random day (62%). Three months later it was higher 70% of the time.
- Seven is where the short term gets ugly. If Friday closes below 7,175.83, the streak hits seven. After the previous 46 seven-day streaks, the 1-month median was -0.17% and only 48% were higher. That is a coin flip, and worse than a normal month.
- The long run usually won. Twelve months after a seven-day streak, the S&P 500 was higher 78% of the time with a median gain of 13.65%, above the 10.67% baseline.
- The bad cases were really bad. The worst 12 months after a seven-day streak came after November 1973 (-28.4%) as the 1973-74 bear market played out. The last seven-day streak ended Feb. 28, 2020: the S&P 500 fell another 11.1% in the next month, then finished the following 12 months up 32.1%.
- The last six-day streak, April 2024, was followed by a 6.9% gain over the next month.
- VIX spikes above 30 have usually been late, not early. After the first VIX close above 30 in 22 episodes since 1990, the S&P was higher a week later 73% of the time. The ugly exceptions were 2008 (-16.3% over the next month) and 2020 (-14.7%), when the spike was the start of a crisis, not the end.
History is a base rate, not a forecast. Small samples, very different eras, and none of these past streaks came with a record AI IPO and a Fed that is priced to hike.
Is the stock market crashing?
Not by the usual definitions, at least not yet for the S&P 500. A correction is a 10% drop from a high and a bear market is 20%. At Thursday's close the S&P 500 was 8.2% below its Oct. 6 record close of 7,818.93; a 10% correction would be a close at or below about 7,037 (our math from TradingView closes). The Nasdaq was 13.6% below its Oct. 6 record before Friday's open, already in correction territory (Reuters via Investing.com). The Dow closed below 50,000 for the first time since June 10 and is nearing a correction (Investopedia, Yahoo Finance). The S&P 500 was down 5.1% for the week through Thursday, on pace for its worst week since the April 2025 tariff selloff (Deutsche Bank via FXStreet).
The selling is not limited to stocks. Bitcoin was near $61,400 Friday morning, its lowest since early July, and gold was near $3,570 after dipping to $3,514.56 overnight (TradingView, Yahoo daily history). Our Bitcoin crash explainer from Nov. 14 covers the crypto side.
Markets at about 7:10 AM PT Friday
| Market | Ticker | Price | Move today |
|---|---|---|---|
| S&P 500 | SPX | 7,179 | about flat (low 7,133.55) |
| Nasdaq 100 | NDX | 26,206 | -1.2% |
| Dow Jones | DJI | 49,444 | +0.7% |
| VIX | VIX | 27.4 | -3.5% (high 31.59) |
| Nvidia | NVDA | $141.33 | -3.2% |
| Alphabet | GOOGL | $280.49 | +2.9% |
| Anthropic | ANT | $90.64 | -6.7% |
| Micron | MU | $651.79 | -5.6% |
| Marvell | MRVL | $132.29 | -4.5% |
| 10-year Treasury yield | US10Y | 4.98% | -6.4 bps |
| Bitcoin | BTCUSD | $61,365 | -0.9% |
| Gold | XAUUSD | $3,572 | -1.4% |
Source: TradingView, about 7:10 AM PT Nov. 20, 2026. Intraday prices move fast; these are a snapshot, not live quotes.
What to watch next: if/then
- If the S&P 500 closes below 7,175.83 today, the streak hits seven, the longest since the February 2020 pandemic slump per Deutsche Bank, and the 1-month base rate above turns into a coin flip.
- If it closes green, the streak ends at six. Historically that kind of streak has not been a reliable sell signal on its own.
- If the VIX closes above 30, it joins the 22 first-close episodes in our table. If it fades back toward the low 20s, Friday's spike looks like expiration-day hedging rather than panic.
- If the S&P 500 closes below about 7,037, it is officially in a correction, 10% off the Oct. 6 record.
- If Nvidia keeps making new lows, the AI trade has not found a floor, and the Nasdaq leads the next leg.
- If Polymarket's December hike odds fall from about 92%, that would be the first sign the Fed is easing up on markets. Next week is a holiday-shortened Thanksgiving week, which can mean thin liquidity and bigger swings.
FAQ
Why is the stock market down this week?
A selloff in AI and chip stocks spread across the market. Worries about AI spending returns, Nvidia's leadership turmoil, new chip export limits and a Fed priced to raise rates in December all hit at once, and Anthropic's record IPO on Nov. 19 failed to turn sentiment. The S&P 500 fell six straight sessions through Nov. 19, 2026.
How long is the S&P 500 losing streak?
Six straight down closes through Thursday, Nov. 19, 2026, the longest since April 2024. A seventh down close on Friday would be the longest since February 2020, according to Deutsche Bank.
What does it mean when the VIX is above 30?
The VIX estimates expected S&P 500 volatility over the next 30 days from option prices. Above 30 is generally read as high stress. It hit 31.59 on Nov. 20, 2026, the highest since March. In our study of 22 first closes above 30 since 1990, the S&P 500 was higher one month later 68% of the time, but the exceptions (2008, 2020) were large losses.
What happens after the S&P 500 falls 7 days in a row?
In 46 seven-day losing streaks since 1950, the S&P 500's median return was -0.17% over the next month (48% higher), +3.10% over three months (70% higher) and +13.65% over twelve months (78% higher). Price returns, S&P 500 daily closes, computed by CosAnalyst.
Is the stock market crashing?
The S&P 500 was 8.2% below its Oct. 6 record at Thursday's close, short of the 10% correction line near 7,037. The Nasdaq was already more than 10% off its record. Nobody can promise where it bottoms; the levels above show what would change the picture.
Will the Fed cut rates to stop the selloff?
Prediction markets say no. On Polymarket, a 25 basis point hike at the Dec. 8 to 9 meeting was priced at about 92.5% on the morning of Nov. 20, 2026, and any cut at under 1%. See our December Fed odds hub for daily updates.
Not financial advice. Historical returns are price-only S&P 500 returns computed from public daily data and do not predict future results. Intraday prices are a snapshot from about 7:10 AM PT Nov. 20, 2026. Nothing here guarantees any market outcome.
Follow @CosAnalyst on X, like the CosAnalyst Facebook Page for plain-English market notes, and join our Telegram at @CosAnalystSignals.
Your call: Is a seven-day losing streak with the VIX above 30 the flush before the bounce, or the start of something bigger for AI stocks? Pick a side in the comments.