
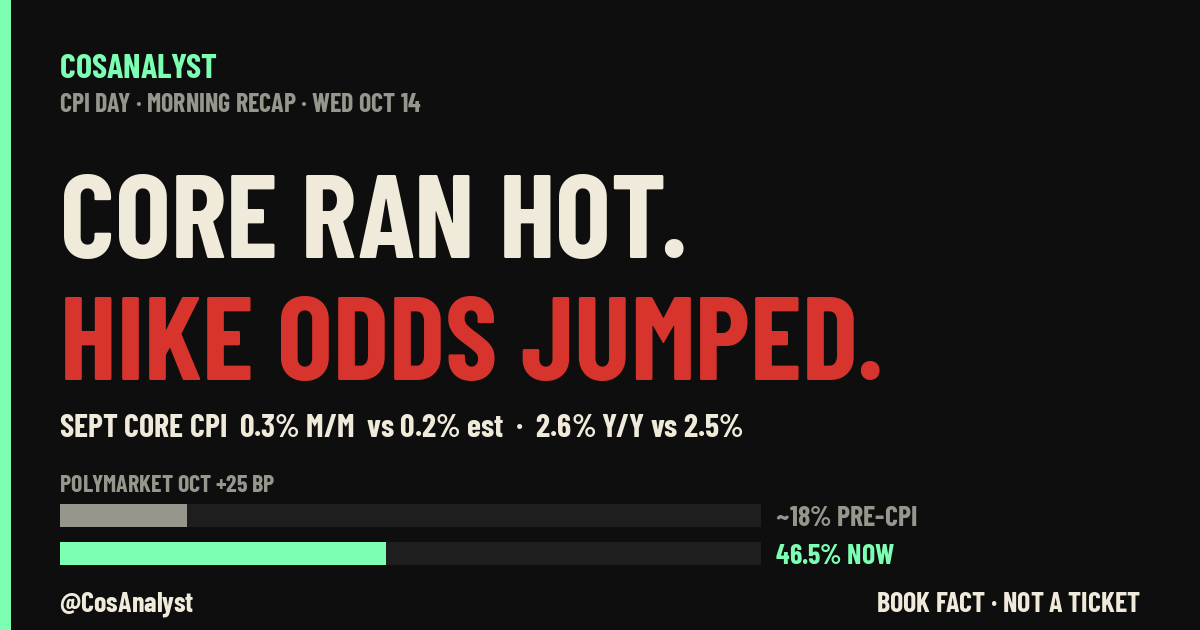
The short answer (as of 5:52 AM PT / 8:52 AM ET, Wed Oct 14, 2026): September core CPI came in hot at 0.3% month over month and 2.6% year over year, a tenth above consensus on both. Headline CPI rose 3.7% year over year against 3.6% expected, with the monthly 0.6% in line. On Polymarket, the odds of a 25 basis point Fed hike at the Oct 27-28 meeting went from about 18% before the print to 38.5% right after and 46.5% now. The 2-year Treasury yield jumped about 12 basis points to 4.92%, and Nasdaq and small-cap futures are taking the biggest hit.
Update, 12:45 PM ET: the hot CPI hangover deepens
Four hours after the print, the hot CPI October 2026 story has moved from futures to the cash tape, and the selling has widened. As of 12:45 PM ET, SPY is down 0.99% at 770.27, QQQ is off 1.63% and the small-cap IWM has dropped 1.82%. The VIX has climbed 7.53% to 16.42. The 10-year Treasury yield sits at 5.236%, the dollar index (DXY) is up 0.60%, and $WTI is up 1.70% near $95.74, which keeps the pressure on headline inflation.
The rotation is textbook risk-off. Health care (XLV, +2.07%) and consumer staples (XLP, +1.31%) lead the sector board, with energy (XLE, +0.55%) also green. Semiconductors are the weak link: SMH is down 3.18% and technology (XLK) 2.40%, as investors sell the stocks most sensitive to higher rates. High-yield credit (HYG, -0.39%) is soft as well.
Fed hike odds for October have settled below their early-morning high but remain far above where they stood before the report. As of midday, Polymarket prices a 25 basis point hike at the Oct 27-28 meeting at 33.5%, with no change at 65.5%. CME FedWatch, as reported after the print, puts the October hike closer to 44%, against about 56% for a hold. The two venues disagree, and the gap is worth watching: the prediction market still leans harder toward a skip than futures do. For December, Polymarket shows a 79.5% chance of a 25 basis point hike, while FedWatch puts the cumulative odds of at least one 25 basis point increase near 55% and of 50 basis points near 40%.
The calendar does not let up. Richmond Fed President Barkin speaks at 1:30 PM ET, and the Beige Book follows at 2:00 PM ET. With PPI tomorrow, Thursday is the bigger test: PPI, retail sales and jobless claims all land at 8:30 AM ET, and Fed Chair Warsh speaks Thursday night at 11:30 PM ET. Friday brings monthly options expiration. The original 5:52 AM PT report follows below.
Yesterday the crowd and the economists agreed on one thing: whatever happened to the headline, core inflation would behave. Polymarket's favorite outcome for core CPI year over year was 2.4%, a tick softer than Wall Street's 2.5%. The number that actually printed at 8:30 AM ET, 2.6%, carried just an 8.5% chance. In about the time it takes to refresh a screen, the market for an October rate hike went from a long shot to something close to a coin flip.
That is the story of this CPI day. Not that inflation ran hot, because the headline was always expected to be firm with $WTI near $95. It is that the part of the report the Federal Reserve watches most closely came in above every consensus, and both the forecasters and the prediction market were standing on the wrong side of it. Here is what the print said, how markets are repricing it before the open, and how to read the rest of the week into the Oct 27-28 FOMC meeting.
What drove the print
Start with the pump. Energy prices jumped 5.2% in September and are up 20.4% from a year ago, according to the Bureau of Labor Statistics. Gasoline alone rose 9.1% on the month and 34.2% on the year, and the BLS said it accounted for more than half of the 0.6% monthly rise in headline CPI. Fuel oil climbed 15.3% in a month and 74.2% in a year. The utility bill was the exception: electricity rose just 0.2% and natural gas fell 0.3%. Food, the other volatile piece, was flat, at 0.0% on the month and 2.5% on the year, with groceries down 0.1% and restaurant meals up 0.2%.
That explains a hot headline. It does not explain a hot core, and core is what moved the Fed odds. Core prices rose 0.3% against the 0.2% consensus, and the annual rate climbed from 2.4% in August to 2.6%. The gains were broad rather than concentrated. Core services excluding energy rose 0.4% on the month, led by transportation services at 0.6% and airline fares at 1.2%, now up 22.4% from a year ago. Core goods rose 0.3%, with used cars up 0.7%, apparel 0.3% and new vehicles 0.2%. Recreation rose 0.5% and education 0.6%.
Airfares are where the two stories meet. Before the release, Franklin Templeton's Schulze said second-order energy effects show up most in airfares (Morningstar). Fuel costs that start at the refinery end up in the price of a plane ticket, which is how an energy shock leaks into core. Reuters' preview had flagged the same mix of risks: broad gains in used cars, airfares, hotels, recreation and apparel, while owners' equivalent rent and rent stayed modest (Reuters via Investing.com). That is close to what printed.
Housing was firm, but it was not the engine. Shelter rose 0.4% on the month and 3.2% on the year. Owners' equivalent rent rose 0.3% and rent 0.2%, both modest. The jump came from lodging away from home, meaning hotels, which rose 2.0% in a month. A few categories pulled the other way. Medical care rose only 0.1%, as a 1.2% drop in prescription drugs offset a 0.3% gain in medical services and 0.7% in hospital services. Communication fell 0.2%.
| Category | Month over month | Year over year |
|---|---|---|
| Headline CPI | +0.6% | 3.7% |
| Core CPI | +0.3% | 2.6% |
| Energy | +5.2% | +20.4% |
| Gasoline | +9.1% | +34.2% |
| Fuel oil | +15.3% | +74.2% |
| Food | 0.0% | 2.5% |
| Shelter | +0.4% | 3.2% |
| Core goods | +0.3% | 0.7% |
| Core services ex-energy | +0.4% | 3.1% |
| Airline fares | +1.2% | +22.4% |
| Used cars | +0.7% | n/a |
| Lodging away from home | +2.0% | n/a |
Source: BLS, Consumer Price Index, September 2026. n/a means the year-over-year figure is not cited here.
Households feel it. A Reuters/Ipsos poll found that about 78% of Americans blame tariffs and the Iran war for rising prices. For the Fed, the question is narrower: whether energy is now spreading into services through channels like airfares and hotels. This report points that way.
September CPI 2026: what the report said
| Measure | Actual | Consensus | Prior |
|---|---|---|---|
| Headline CPI, year over year | 3.7% | 3.6% | 3.4% |
| Headline CPI, month over month | 0.6% | 0.6% | 0.4% |
| Core CPI, year over year | 2.6% | 2.5% | 2.4% |
| Core CPI, month over month | 0.3% | 0.2% | 0.3% |
Source: BLS via TradingView economic calendar. Consensus cross-checked with FactSet (AP), Investing.com and FXStreet/Danske Bank.
Core CPI strips out food and energy, so it is the cleaner read on whether price pressure is spreading beyond the gas pump. A 0.3% monthly core gain is not dramatic on its own; the prior month was also 0.3%. What makes it hot is the gap to expectations. Consensus had pencilled in a cooling to 0.2%, and the annual rate was supposed to tick up only to 2.5%. Instead it climbed two tenths from August's 2.4% to 2.6%.
Polymarket vs consensus: the crowd missed core
Prediction markets have built a reputation for getting to the data first. This morning was a useful reminder that they are a crowd, not an oracle. Here is how Polymarket priced each CPI bracket at the last trade before the release, against the economists and the actual print.
| Market | Consensus | Polymarket pre-print | Actual |
|---|---|---|---|
| Headline YoY | 3.6% | 3.6% at 45.5%, 3.7% at 41% | 3.7% |
| Headline MoM | 0.6% | 0.6% at 56.5%, 0.5% at 28.5% | 0.6% |
| Core YoY | 2.5% | 2.4% at 50%, 2.5% at 38.5%, 2.6% at 8.5% | 2.6% |
| Core MoM | 0.2% | 0.2% at 44%, 0.3% at 31% | 0.3% |
Source: Polymarket gamma API and CLOB price history, last trade at or before 5:25 AM PT.
On the headline, the crowd did fine. It put 41% on 3.7%, close to even with the consensus 3.6%. On core, it leaned the wrong way. Its favorite annual core reading was a tenth below consensus, and the outcome that printed was a single-digit probability. Economists were too low by a tenth; the crowd was too low by two. The lesson is not that prediction markets are useless. It is that a crowd leaning softer than consensus is a view, and views can be wrong.
Fed October hike odds: from long shot to coin flip
The market that moved most was the one about the Fed itself. Polymarket's "Fed Decision in October?" contract, with $37.0 million in volume, settles after the Oct 27-28 meeting.
- 25 bp hike in October: about 18% before CPI, 38.5% right after, 46.5% now.
- No change in October: 81.5% before the print, about 53% now.
- 25 bp hike in December: 77.5%, with no change at 20%.
- Another hike in 2026: 80.5% before the print, 86% to 88% now.
- End-2026 fed funds rate: 4.25% at 55.7%, 4.0% at 22.75%, 4.5% or higher at 21.85%.
Put simply, the market already believed the Fed was not done hiking this year. What changed this morning is the timing. Before the print, Danske Bank wrote that "it would take a clear upside surprise for the Fed to signal a rate hike already in October" (via FXStreet). A tenth above on both core measures is not a shock, but it is the kind of surprise that keeps that door open. We did not pull a CME FedWatch reading, so there is no futures-implied comparison here.
The 2-year speaks: yields up, Nasdaq and small caps hit
Bonds gave the fastest and clearest verdict. The 2-year Treasury yield, the maturity most sensitive to Fed policy, rose about 12.3 basis points to 4.92%. The 10-year rose about 8.7 basis points to 5.30%. When the short end moves faster than the long end, the curve bear-flattens, which is exactly what a market pricing a nearer hike looks like. The dollar index rose 0.43% to 102.66.
Stocks are sorting themselves by rate sensitivity. S&P 500 futures are down 0.35% at 7,828.5 and Dow futures 0.18%, but Nasdaq 100 futures are off 0.66% and Russell 2000 futures 1.08%. Since 5:00 AM PT, before the release, S&P futures have given up about 38 points and Nasdaq futures about 155. In premarket ETF trading, $SPY is down 0.18% at 776.61, $QQQ 0.44% at 740.33 and $IWM 0.75% at 274.63. Tech ($XLK, -0.92%) and semiconductors ($SMH, -1.25%) lead the decline.
Elsewhere, the VIX is up modestly at 15.47, gold is down 1.05% to $4,133.6, Bitcoin is off 0.41% at $82,727 and $WTI is up 1.56% at $95.61. Premarket quotes run about 15 minutes delayed and futures about 10 minutes, so these marks sit a few minutes after the print.
Why QQQ is weaker than SPY today
The split between the Nasdaq and the S&P is not only about rates. It is also about how options dealers are positioned. Going into today, dealer positioning in SPY options looks like the kind that tends to dampen moves: as price falls, hedging flows lean against it, which acts like a cushion. QQQ has much less of that cushion, and its positioning had already turned sharply defensive into the print. With less of a buffer, the same rate shock travels further. Early trade fits that picture, with QQQ falling roughly twice as fast as SPY.
Heavy put open interest into Friday's monthly options expiration adds to the picture. The desk's read of SPY options expiring Oct 16 shows a put-to-call open-interest ratio of 3.39, and 1.77 for QQQ. That is a market that came into CPI hedged.
The levels options are pricing for QQQ
Before the release, at-the-money straddles priced a move of about 0.86% for QQQ today and about 1.37% through Friday. Measured from Tuesday's close of 743.57, that puts the options-implied low near 737 today and near 733 through Friday. For SPY, the implied range today was about 0.53%, roughly 774 to 782.
- About 737: the low end of today's implied QQQ range. Premarket at 740.33 already sits in the lower half.
- About 733: the low end of the implied range through Friday's expiration.
- 744 (Tuesday's close): our analysis treats a reclaim of this level as cancelling the bearish read on QQQ.
Analysis, not trade advice. Implied ranges describe what options were pricing before the print. They are not targets, and price can move outside them. BOOK FACT · NOT A TICKET.
Someone keeps buying year-end crash protection
One positioning story predates CPI and matters more after it. According to VolSignals, buyers added another 9,700 Dec 31 SPX 7250 puts on Oct 13, in clips of 200 to 350 contracts. That position is now about 51,000 contracts, built from flat in seven sessions, for roughly $270 million in premium. VolSignals called the pre-CPI positioning shape "a red flag." With S&P futures near 7,828, those strikes sit far below the market, which makes them insurance rather than a forecast. But someone is paying real money for that insurance, and they started before this morning's surprise.
Bank earnings split: BAC's penalty vs BlackRock's beat
The banks reported before the open, and they are moving in opposite directions. Bank of America ($BAC) is down 6.1% premarket at 50.66. Its third-quarter profit fell 17% to $0.91 a share because of a $1.2 billion Treasury penalty over money-laundering violations; without it, the bank earned $1.08 (CNBC). The penalty was announced Tuesday evening, as we covered in CPI Tomorrow, and it is weighing on financials ($XLF, -0.58%).
BlackRock ($BLK) is the other side of the ledger, up 3.4% at 1,102 after adjusted EPS of $15.93 against $14.13 expected, with assets under management of $15.49 trillion against $13.46 trillion a year ago (CNBC). Morgan Stanley ($MS) beat on EPS and revenue but is roughly flat, down 0.3%, with an equities beat offset by an investment-banking miss. That follows Tuesday's session, when JPMorgan and Goldman slipped on fixed-income misses and Citi fell 5.6% (Banks Beat, Stocks Sold).
- State Street ($STT): -8.1% premarket after reporting. The cause of the move is not verified.
- Progressive ($PGR): -5.0% after reporting. Cause not verified.
- Fastenal ($FAST): -5.7% after reporting. Cause not verified.
- ASML ($ASML): -0.9%. Q3 net sales of EUR 11.66 billion slightly missed the EUR 11.72 billion estimate, but net profit beat (CNBC) and it raised its annual outlook again (Investing.com).
- HPE and Dell: -4.9% and -3.4% after Barclays cut both to equal weight (CNBC).
Navigating the rest of the week into the October FOMC
This morning's print changes the question for the next two weeks. It is no longer whether the Fed hikes again in 2026, which the market already expected. It is whether it hikes on Oct 28. Every remaining data point this week will be read through that lens.
- Wed Oct 14, 1:30 PM ET / 10:30 AM PT: Richmond Fed's Barkin speaks.
- Wed Oct 14, 2:00 PM ET / 11:00 AM PT: The Fed's Beige Book, its anecdotal survey of regional conditions. Watch the language on prices and wages.
- Wed Oct 14, 10:55 PM ET / 7:55 PM PT: Fed Governor Bowman speaks.
- Thu Oct 15, 8:30 AM ET / 5:30 AM PT: PPI (forecast 0.5% month over month, prior 0.4%; core 0.3%, prior 0.2%), retail sales (0.3%, prior 1.2%; control group 0.3%, prior 1.4%), jobless claims (200K), Philly Fed and Empire State.
- Thu Oct 15, 11:30 PM ET / 8:30 PM PT: Fed Chair Warsh speaks, the highest-importance event of the week for October odds.
- Fri Oct 16: Import prices, industrial production, and monthly options expiration.
- Tue-Wed Oct 27-28: FOMC meeting, with the decision on Wednesday Oct 28 (Federal Reserve calendar).
Thursday is the real hinge. A hot PPI would confirm that price pressure is building in the pipeline, and strong retail sales would tell the Fed consumers can absorb tighter policy. Then Warsh gets the last word that night. If he leans into this morning's data, the October odds have room to climb past even. If he talks about patience and the December meeting, a large part of today's repricing could unwind.
How we read the scenarios
- Hot PPI and firm retail sales: the hike case strengthens. Expect the 2-year to keep leading, and the rate-sensitive Nasdaq and small caps to stay under the most pressure.
- Soft PPI or weak retail sales: today could look like a one-tenth scare. October odds would likely drift back, and QQQ reclaiming 744 would be the market's signal that the bearish read is off.
- Mixed data: Warsh decides. Prediction markets will likely swing hardest Thursday night, after the cash close.
Our base case is that this morning moved the timing, not the destination. The market already priced at least one more hike in 2026; core CPI just made October a live meeting. Until Thursday's data and Warsh say otherwise, the reaction belongs to the 2-year yield, and stocks with the least cushion feel it first.
FAQ
What drove September CPI?
Energy drove the headline. Energy prices rose 5.2% on the month and gasoline 9.1%, which the BLS said accounted for more than half of the 0.6% monthly rise. Food was flat. Core rose 0.3% on broad gains in airline fares, used cars, hotels, recreation and apparel.
Why did core CPI beat expectations?
Core rose 0.3% against a 0.2% consensus because gains were broad. Airline fares rose 1.2%, a channel where higher fuel costs feed into core prices, alongside used cars (+0.7%), hotels (+2.0%), recreation (+0.5%) and apparel (+0.3%). Rent (+0.2%) and owners' equivalent rent (+0.3%) stayed modest.
What was September CPI 2026?
September CPI rose 3.7% year over year and 0.6% month over month, released Oct 14, 2026 at 8:30 AM ET. Consensus was 3.6% and 0.6%. Core CPI rose 2.6% year over year and 0.3% month over month, against 2.5% and 0.2% expected.
Why is core CPI hot?
Core CPI, which excludes food and energy, came in a tenth above consensus on both the monthly (0.3% vs 0.2%) and annual (2.6% vs 2.5%) measures. The annual rate rose from 2.4% in August, a sign that price pressure is not limited to energy.
What are the Fed October hike odds after CPI?
On Polymarket, the odds of a 25 bp hike at the Oct 27-28 FOMC rose from about 18% before CPI to 38.5% right after and 46.5% as of 5:52 AM PT. No change fell to about 53%. Odds of a December hike are 77.5%.
Did Polymarket predict the CPI report?
Partly. It priced the 3.7% headline at 41%, close to even with consensus. But it gave the actual 2.6% core reading only an 8.5% chance, and its favorite was 2.4%, softer than economists' 2.5%.
When is the next FOMC meeting?
The Federal Reserve's calendar lists the next FOMC meeting for Oct 27-28, 2026, with the policy decision on Wednesday Oct 28.
Why are Nasdaq and small caps falling more than the S&P 500?
Higher short-term yields hit growth and small-cap stocks hardest. Options positioning also gives SPY more of a cushion than QQQ, so the same shock moves QQQ further. Nasdaq futures are down 0.66% and Russell futures 1.08%, against 0.35% for S&P futures.
What is next after the hot CPI report?
As of 12:45 PM ET Wednesday, Barkin speaks at 1:30 PM ET and the Beige Book is out at 2:00 PM ET. Thursday brings PPI, retail sales and jobless claims at 8:30 AM ET, then Fed Chair Warsh at 11:30 PM ET. Friday is monthly options expiration. Midday Fed hike odds for October were 33.5% on Polymarket and about 44% on CME FedWatch.
What economic data is out Thursday Oct 15?
PPI, retail sales, jobless claims, Philly Fed and Empire State at 8:30 AM ET, then Fed Chair Warsh speaks at 11:30 PM ET.
Follow the desk
Follow @CosAnalyst on X for the read on PPI, retail sales and Warsh as they land. Join the free Cos Analyst Signals channel on Telegram for research notes and posted receipts, wins and losses: https://t.me/CosAnalystSignals. Nothing there is financial advice.
BOOK FACT · NOT A TICKET. CosAnalyst research and analysis, not financial advice or a trade recommendation. CPI data and component detail from the BLS and the TradingView economic calendar; Reuters preview via Investing.com; Franklin Templeton comment via Morningstar; Reuters/Ipsos poll; consensus from FactSet (AP), Investing.com and FXStreet/Danske Bank. Prediction-market odds from Polymarket (gamma API and CLOB price history); midday CME FedWatch figures as reported by Gate News, PANews and CNBC. Quotes, yields and futures from TradingView, with stocks and ETFs about 15 minutes delayed and futures about 10 minutes. Earnings and analyst actions from CNBC and Investing.com; earnings schedule and Beige Book time from Bespoke; year-end put flow from VolSignals on X. FOMC date from the Federal Reserve calendar. Options-implied ranges are from the CosAnalyst desk. Prediction-market odds can change quickly.