
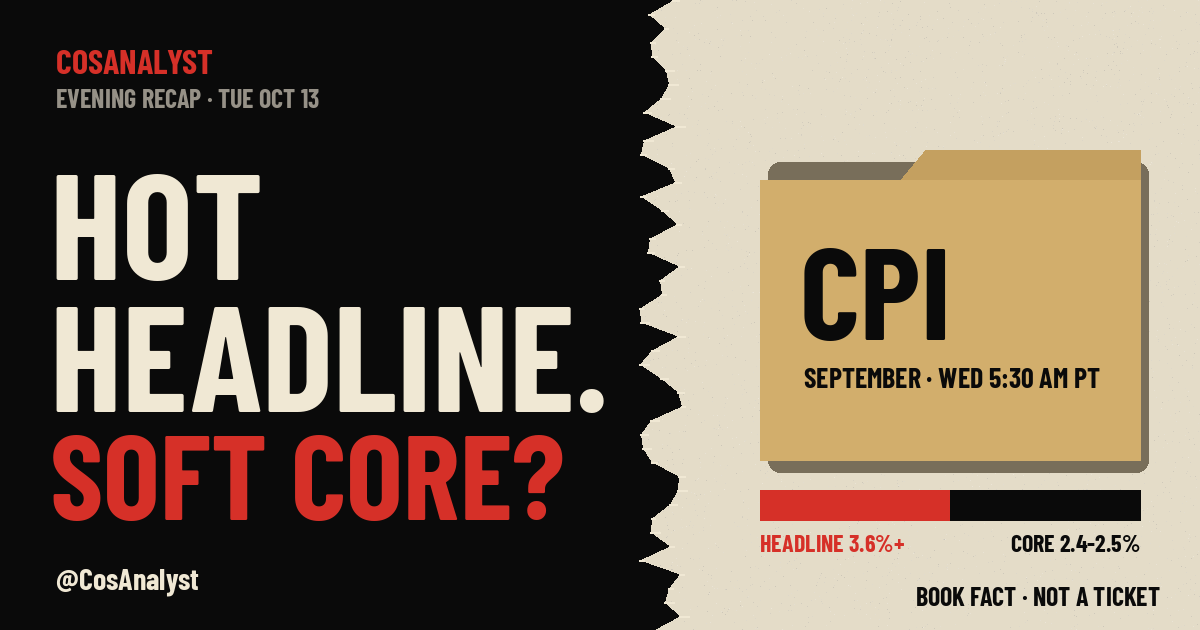
The short answer (as of 1:53 PM PT, Tue Oct 13, 2026): The S&P 500 closed flat at 7,805.45 (-0.02%) on a rotation day, with energy up 1.8% and health care down 1.35%. The September CPI report is out tomorrow, Wed Oct 14, at 8:30 AM ET / 5:30 AM PT. Wall Street expects 0.6% month over month and 3.6% year over year, with core at 0.2% and 2.5%. Polymarket leans hotter on the headline and softer on core.
Two crowds are betting on the same number tomorrow morning, and they do not agree on what it will say. Wall Street's consensus for September's consumer price index is a 3.6% annual headline and a 2.5% core. On Polymarket, the single most likely headline outcome is still 3.6%, at 43%, but almost half the money sits on something hotter: 38.5% on 3.7% and 11% on 3.8%. On core, the crowd tilts the other way, with 2.4% the favorite at 43.5% and the consensus 2.5% at 34%. Hot headline, soft core. That is the bet the market carried into the close.
And the stock market today behaved exactly like a market that knows a verdict is coming. The S&P 500 finished at 7,805.45, down 0.02%, after trading in a narrow 28-point band between 7,786.11 and 7,814.15. Underneath that flat line, money moved hard: only 266 of 503 stocks finished flat or higher, energy ran, health care sank, and the bond market quietly bought duration. Here is how the pieces fit, and why tomorrow's CPI report decides which of them was right.
Stock market today: flat index, loud rotation
The index tells you almost nothing about today. The sectors tell you everything. Energy ($XLE) led at +1.80%, followed by communication services (+0.74%), utilities (+0.58%) and materials (+0.57%). At the bottom sat health care ($XLV) at -1.35%, financials ($XLF) at -0.42% and industrials at -0.28%. Technology was a rounding error at -0.04%.
- S&P 500: 7,805.45, -0.02%. $SPY 778.01, -0.01%.
- Nasdaq 100: 30,569.48, -0.31%. $QQQ 743.57, -0.33%.
- Small caps: $IWM 276.70, -0.43%. $DIA 516.21, -0.33%.
- VIX: 15.27, +0.06.
- Breadth: 266 of 503 S&P names flat or up.
Chips were mixed rather than broken. The SOX slipped 0.23% and $SMH 0.49%, while Nvidia rose 0.97% and Broadcom 0.73%. The weak spot was Applied Materials ($AMAT), which fell 6.69% around its investor day. Reuters reported the company sees service revenue growing more than 20% in 2026, and Barron's flagged what the presentation left out. Wire headlines summed up the mood: Dow Jones led with chips hit by China fears, and Reuters with AI spending worries hitting chipmakers.
Bank earnings were the morning's main event, and we covered them in full in Banks Beat, Stocks Sold. The short version: Citi fell 5.60%, Wells Fargo 3.10%, Bank of America 1.14% and JPMorgan 0.86%. Private-markets names joined them, with KKR down 4.75% and Blackstone down 4.18%.
Why are oil prices going up? Energy's breakout near $95
The cleanest trend on the board was in energy. $WTI settled near $94.92, up 1.26%, and the refiners did better than the crude: Valero rose 4.69%, Phillips 66 4.00% and Marathon Petroleum 3.96%. The desk's catalyst note is that Morgan Stanley raised its Brent forecast, which gave energy stocks a fresh fundamental reason on a day when investors were already hunting for anything not tied to rates or AI capex.
Oil prices today also matter for tomorrow. Energy is a direct input to headline CPI and not to core, which is exactly why the prediction market can lean hot on one and soft on the other at the same time. Oil near $95 is the bridge between today's tape and tomorrow's print.
Why is J&J stock down after earnings?
Johnson & Johnson ($JNJ) did what companies are supposed to do. It beat on revenue, $25.4 billion against about $25.28 billion expected, beat on adjusted EPS at $2.59, and raised full-year guidance (company release, LSEG via Reuters). The stock fell 5.73%, its worst day since April 2025.
The reason was MedTech. Device sales rose 2.5% to about $8.6 billion, short of the $8.71 billion estimate, the second straight quarter the unit missed (Reuters). Management called the result below its own standard. J&J had gained more than 27% this year before the report (Yahoo Finance), so the bar was high. Its drop dragged health care to the bottom of the sector table, and it rhymes with the banks: in this tape, a beat-and-raise is the entry fee, not the prize.
Why was Bank of America fined $1.21 billion?
After the bell, Bank of America agreed to pay $1.21 billion over anti-money-laundering and sanctions violations. The Treasury Department said it imposed $1.2 billion in penalties, which the Associated Press described as the third-largest in the department's history, and reports put the total at $1.21 billion including a smaller sanctions settlement with the Office of Foreign Assets Control (AP, NBC News, CNN). The cases center on failures in Bank Secrecy Act compliance and apparent sanctions violations.
Bank of America fine is now trending in search, with more than 1,000 queries on the desk's tracker. The stock had already slipped 1.14% in the regular session. The fine lands on the eve of the bank's own earnings report Wednesday, so the first read on how investors price it will come alongside the quarter and alongside CPI.
Bonds bull-flatten and the Fed odds
The bond market told a calmer story than the equity desk. The 10-year Treasury yield fell 2.3 basis points to 5.219% and the 30-year fell 3.5 basis points to 5.565%, while the 2-year edged up 0.4 basis points to 4.795%. That is a bull flattener, with the 2s10s spread near +42 basis points. The dollar index slipped 0.36% to 102.21, gold fell 0.28% to 4,159 and Bitcoin rose 1.87% to 83,290.
Prediction markets still price a Fed that is not done. Polymarket shows an 80.5% chance the Fed holds in October and 19.5% for a hike, but 74.5% for a hike by December against 23.5% for a hold. Separately, traders give 59.5% odds that the 10-year touches at least 5.32% in October, and 26.5% that it reaches 5.41%. Fed Governor Waller, Richmond's Barkin and Boston's Collins were on the calendar today; we are not quoting them here. On data, September existing home sales came in at 3.99 million against 3.95 million expected, and ADP's weekly number showed +24,750 jobs.
What is the CPI forecast for September?
- Headline CPI month over month: consensus 0.6%. Polymarket: 0.6% at 49%, 0.5% at 34%.
- Headline CPI year over year: consensus 3.6%. Polymarket: 3.6% at 43%, 3.7% at 38.5%, 3.8% at 11%.
- Core CPI month over month: consensus 0.2%. Polymarket: 0.2% at 50.5%, 0.3% at 31%.
- Core CPI year over year: consensus 2.5%. Polymarket: 2.4% at 43.5%, 2.5% at 34%.
Read that table as a split decision. On the annual headline, roughly half the prediction-market money sits above consensus. On annual core, the favorite is a tenth below it. Core expectations are what the Fed watches most, and they are where the market has the most room to be relieved.
Free channel receipts
We post every free-channel signal, wins and losses, so here is today straight. Two $IWM longs, both posted with receipts:
- IWM 2-minute long: 2:12 PM ET at 276.99, stop 276.55, time exit at 277.03. Result: +0.09R.
- IWM 5-minute long: 2:25 PM ET at 277.06, stop 276.62, exit at 277.03. Result: -0.07R.
- Net: about +0.02R. Call it flat.
A flat day on a flat tape. Small caps closed down 0.43%, and neither trade found follow-through.
Sector Selector model read: $XLE
Our Sector Selector model, which is still in testing, ranked energy first today with a score of 100, ahead of technology at 68 and health care at 64. It produced a fresh hypothetical long read on $XLE: entry 67.20, stop 65.27, first target 69.13 and a 3R target at 73.00, with a 20-day time stop. In out-of-sample testing the model logged 166 hypothetical trades with a 41% win rate, a 1.43 profit factor and +0.25R average.
Model read, hypothetical, not a live alert. This is a test-model output shared for research. It is not a trade recommendation and not financial advice. BOOK FACT · NOT A TICKET.
What to watch: Wednesday to Friday (PT)
- Wed Oct 14: Fed's Bowman 2:40 AM. September CPI 5:30 AM PT / 8:30 AM ET (consensus 0.6%/3.6%, core 0.2%/2.5%). Bank of America and Morgan Stanley earnings. Barkin 10:30 AM. API crude inventories 1:30 PM. Bowman again 7:55 PM.
- Thu Oct 15: 5:30 AM PT PPI (0.5%, core 0.3%), retail sales (0.3%), jobless claims (200K), Philly Fed (28.4), Empire State (10.3). EIA crude inventories 9:00 AM. Warsh 8:30 PM.
- Fri Oct 16: Import prices 5:30 AM, industrial production 6:15 AM.
Where things likely go from here
Today was a market holding its breath while rearranging its furniture. Money left banks, health care and private-markets names and went to energy and refiners, while the long end of the bond curve rallied. That is not a market positioned for a disaster. It is one that expects oil to keep inflation sticky on the surface and hopes the underlying trend keeps cooling.
- If headline runs hot and core is soft (the Polymarket path): the likely read is energy-driven inflation without broad price pressure. Energy keeps its leadership, the bull flattener can hold, and rate-sensitive groups get a reprieve. December hike odds would probably stay elevated without climbing much.
- If both run hot: this is the risk case. A core at 0.3% or higher would challenge the long-end rally, push the 10-year back toward the 5.32% level traders are already betting on, and hit the banks and chips that wobbled today.
- If both come in soft: yields could fall further, the rotation out of growth could reverse, and Wednesday's bank earnings would get to trade on their own numbers.
- If in line: the market goes back to earnings and oil. Watch whether energy holds its breakout and whether health care finds buyers after J&J.
Our base case leans with the split: oil keeps the headline firm, and the decision for stocks comes down to core. A flat S&P with 266 of 503 names green is not complacency. It is a market waiting to be told which half of the bet was right.
FAQ
What time is CPI released tomorrow?
The September CPI report is released Wednesday, Oct 14, 2026 at 8:30 AM ET, which is 5:30 AM PT. Futures, Treasuries and the dollar usually react within seconds of the release.
What is the CPI forecast for September?
Consensus is 0.6% month over month and 3.6% year over year for headline CPI, with core at 0.2% and 2.5%. Polymarket leans hotter on headline, with 49.5% combined on 3.7% or 3.8%, and softer on core, with 2.4% the favorite at 43.5%.
What is the difference between headline and core CPI?
Headline CPI measures all consumer prices, including food and energy. Core CPI strips out food and energy because they swing sharply, so it gives a cleaner view of the underlying trend the Fed watches.
Why was Bank of America fined?
Bank of America agreed to pay $1.21 billion over anti-money-laundering and sanctions violations, including failures in Bank Secrecy Act compliance. The Treasury penalty of $1.2 billion is among the largest in the department's history, according to the AP.
Why are oil prices going up?
$WTI rose 1.26% to about $94.92 as energy led the S&P 500, and Morgan Stanley raised its Brent forecast. Refiners Valero, Phillips 66 and Marathon Petroleum each gained about 4% to 4.7%.
Why is J&J stock down after earnings?
J&J beat on revenue and adjusted EPS and raised its 2026 guidance, but its MedTech unit missed estimates for a second straight quarter. The stock fell 5.73%, its worst day since April 2025.
Get the free notes
Join the free Cos Analyst Signals channel on Telegram for research notes and posted receipts, wins and losses: https://t.me/CosAnalystSignals. Follow @CosAnalyst on X for the CPI read at 5:30 AM PT. Nothing there is financial advice.
BOOK FACT · NOT A TICKET. CosAnalyst research. Not financial advice. Market closes, yields, breadth, prediction-market odds, signals and calendar are from the CosAnalyst desk report for Tue Oct 13, 2026. J&J figures are from the company release, Reuters and Yahoo Finance; Bank of America settlement details from AP, NBC News and CNN. Prediction-market odds can change quickly.