
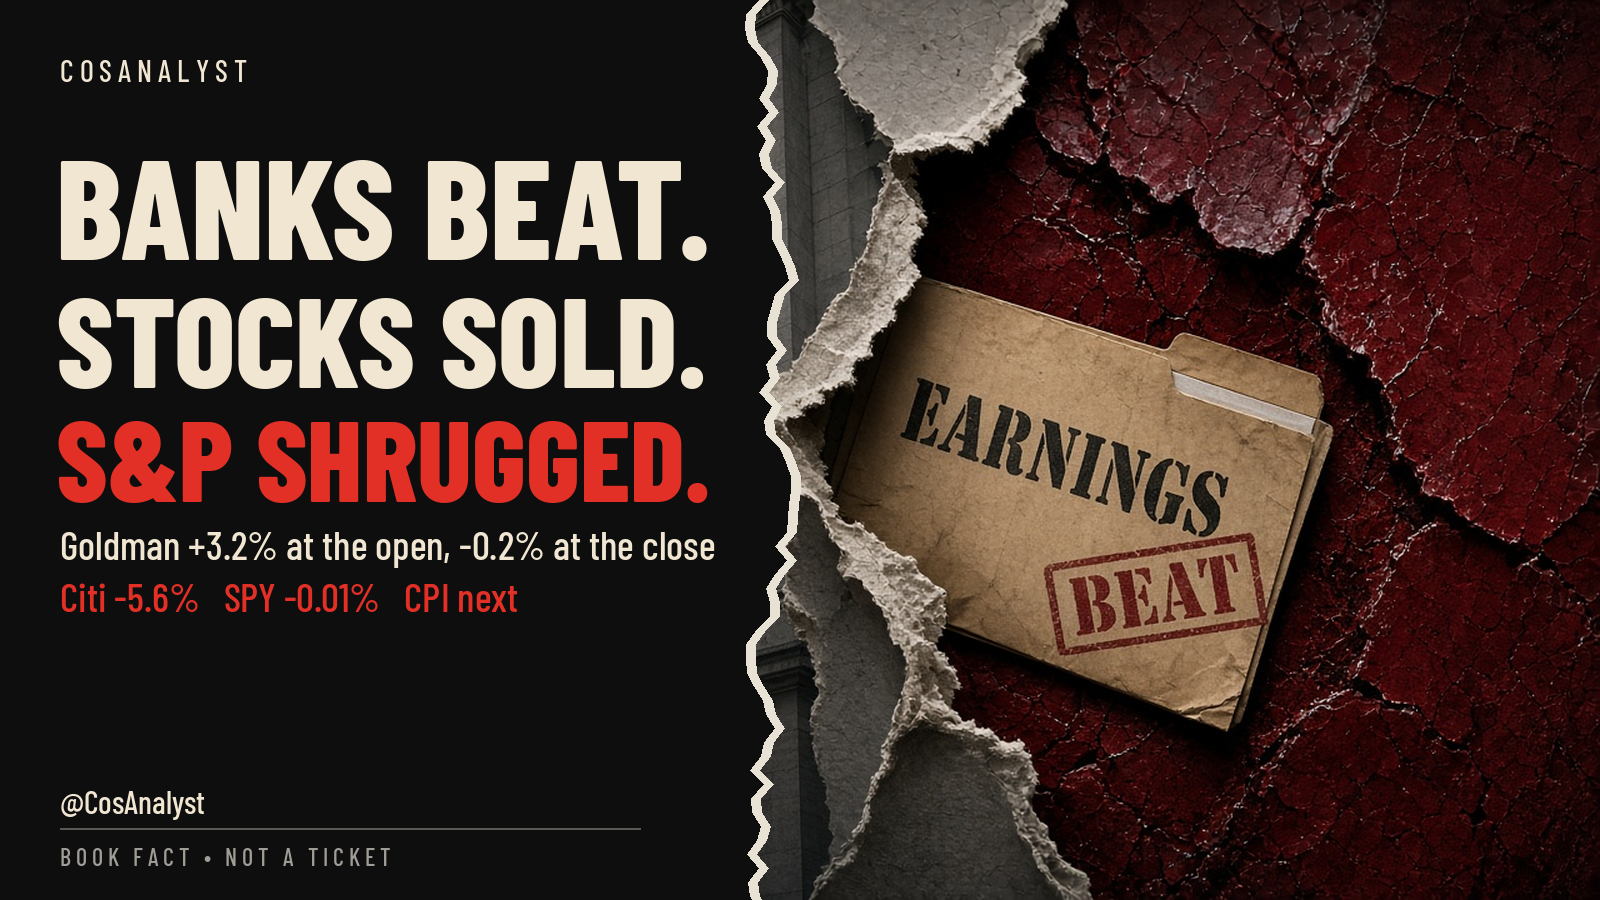
At 6:30 in the morning Pacific time, Goldman Sachs looked like the best trade on Wall Street. The bank had just posted $17.01 a share against a $13.09 consensus, equities trading revenue had jumped 72%, and the stock opened up 3.2% at $923. Seven hours later it closed at $891.91, down 0.2%. Somewhere between the opening bell and the close, the best quarter in years turned into a red candle.
Goldman was not alone. Citigroup, fresh off a quarter that headlines called its best third quarter in a decade, fell 5.6%. Wells Fargo fell 3.1%. JPMorgan fell 0.9%. The S&P 500 ETF ($SPY) finished at 778.01, flat to the penny. Bank earnings for Q3 2026 were, on paper, a victory lap. The tape treated them like a goodbye.
This is the story of why bank stocks fell despite the beat, what that says about a market priced for perfection, and why Wednesday's 5:30 AM PT CPI report now carries more weight than any bank print could.
Bank earnings Q3 2026: the numbers were real
Start with what the banks actually reported, because the selling was not a verdict on bad numbers.
- Goldman Sachs ($GS): EPS of $17.01, up 39% from a year ago, on net revenue of $18.68 billion, up 23% and the second highest in the firm's history. Wall Street expected about $13.09 and $16.86 billion (Investing.com). Equities revenue rose 72% to $6.44 billion. Advisory revenue was a record. Fixed income, currencies and commodities slipped 1% to $3.47 billion (Reuters, company 8-K).
- Citigroup ($C): EPS of $2.85 against a $2.66 estimate, on revenue of $23.85 billion versus $23.72 billion expected (LSEG via CNBC). Net income rose to $5.2 billion from $3.8 billion. Citi also raised its full-year net interest income guidance, excluding markets, to up mid-to-high 6% from 5% to 6%.
- Wells Fargo ($WFC): Net income of $6.0 billion, or $1.87 a share, up 13% per share from a year ago. Net interest income rose 5% to $12.52 billion (company release).
- JPMorgan ($JPM): The exception. Net income of $15.3 billion, or $5.57 a share, $5.75 excluding a significant item, which CNBC called a rare miss. Net interest income still rose 13% to $27.1 billion and markets revenue rose 15% to $10.3 billion (company release).
Three of the four biggest names beat, and the fourth grew its core lending engine by double digits. If you had been handed those headlines on Monday night, you would not have guessed Citi would finish as the worst performer in the group.
Why did bank stocks fall despite the earnings beat?
There is no single villain here. There are four, and they worked together.
1. The beat was already in the price
Citi shares were up about 9% this year before the report and had been outperforming the broader bank index (Reuters via BNN Bloomberg). Goldman was trading near the upper half of a 52-week range that runs from $740.01 to $1,153.99. When a stock has run into a report, a beat is the minimum requirement, not a reward. Traders who bought the run-up used the open to sell into strength, and Goldman's 3.2% gap gave them a perfect exit. That is the mechanical core of every 'sell the news' day: the good news was the reason people owned it, and now the reason is spent.
2. The quarter-over-quarter picture was softer
Year-over-year numbers made the headlines. Sequential numbers told a cooler story. Citi's net income was 10% lower than in the second quarter (Reuters). Its investment banking fees posted the biggest quarter-over-quarter decline in the group, down 13%, and Wells Fargo's investment banking revenue was down 5% from the prior quarter (CNBC). Goldman's own Global Banking and Markets net revenue was 13% lower than in the second quarter (company 8-K). M&A volume across the industry fell 41% from the prior quarter to $993 billion, the first sub-$1 trillion quarter since the second quarter of 2025 (LSEG via Reuters). Markets that look forward care more about direction than distance.
3. Credit is starting to cost more
Wells Fargo's provision for credit losses climbed to $1.03 billion from $681 million a year ago, and net charge-offs rose 11% from the prior quarter (company release). Citi's net income gain was partly offset by a higher provision for credit losses (company release). None of this is a crisis. But when banks set aside more money for loans that might go bad, investors start asking what the banks are seeing in their borrowers that the rest of us are not.
4. Rates are the ceiling over everything
The 10-year Treasury yield closed the session at 5.215%, down 2.7 basis points but still above 5%. Reuters noted the quarter was shaped by the Federal Reserve's September rate hike. High rates help net interest income, and that showed up in JPMorgan's 13% NII growth and Citi's raised guidance. But high rates also squeeze borrowers, push up deposit costs and pressure valuations across the market. Wells Fargo itself flagged higher deposit costs in its release. Banks are the most rate-sensitive sector in the index, and the most important rate data of the month lands Wednesday morning.
What it says about the market
The morning case for a calm index was simple: banks would carry the S&P while chips bled. By the close, the banks had handed their gains back, and the index still finished flat. That is either resilience or a warning, depending on what you think is holding it up.
- Financials ($XLF): closed down 0.4% after trading as high as 55.65.
- Semiconductors ($SMH): bounced 2.3% off a 574.75 low but closed at 588.12, still under Monday's 590.99 close.
- Micron ($MU): closed down 3.6% near $953.
- 10-year yield: 5.215%.
- Oil ($WTI): up 1.1% to $94.77.
- VIX: 15.28, the night before CPI.
Read that list as a balance sheet for the bull market. Its two biggest supports this week, banks on earnings and chips on the AI trade, both wobbled on the same day. The S&P held because nothing collapsed. But a flat index built on two cracking pillars is not the same thing as a strong index. It is an index waiting for a reason.
The VIX tells you how little fear is priced in. A reading near 15 the night before an inflation report says traders expect a quiet morning. Quiet expectations are exactly what make a surprise expensive.
CPI October 2026: the setup for Wednesday 5:30 AM PT
The September consumer price index hits at 5:30 AM PT on Wednesday, Oct 14. For banks and for the index, it is now the single biggest input of the week. Here are the paths.
- If CPI runs hot: yields get a fresh reason to climb back toward and through recent highs. Banks lose the argument that higher rates are pure profit, because credit costs and valuations get hit at the same time. Chips, already under Monday's close, have no cushion. With neither banks nor chips in shape to hold it up, the index is the most exposed it has been all month.
- If CPI comes in cool: yields can ease, and the banks get a second chance to keep their beats. Bank of America and Morgan Stanley report Wednesday, and a soft print would let them trade on their numbers instead of on the macro. That is the rotation path: money moves into financials and the S&P grinds on.
- If CPI is in line: the market goes back to stock picking. Watch whether today's bank sellers come back as buyers. If they do not, today was a top in the trade, not a pause.
Two levels frame it. Watch $SMH against Monday's 590.99 close and $XLF against today's 55.65 high. Our checkable claim from this morning's Board stands: $SMH closes Friday, Oct 16 below 590.99. Today it closed 2.87 under. Score us Friday.
Where things likely go from here
Our base case is that today was not a referendum on the banks. It was a referendum on expectations. The numbers were strong enough to beat, not strong enough to surprise a market that had already paid for them. That distinction matters, because it means the selling is about positioning and rates, both of which can turn fast, rather than about broken businesses.
But the burden has shifted. Before the open, the banks were the reason the index could ignore chips. After the close, they need CPI's help to play that role again. A hot print turns a sell-the-news day into the start of a rate-driven reset across financials and tech at once. A cool print turns it into a buyable shakeout. The bank stocks are no longer leading the market. They are waiting on it, along with everyone else.
FAQ
Why did bank stocks fall after beating Q3 2026 earnings?
Because the beats were largely priced in after a strong run, sequential trends in investment banking and profit were softer, credit provisions rose, and traders were cutting rate-sensitive exposure ahead of Wednesday's CPI report.
How did Goldman Sachs earnings do?
Goldman reported Q3 2026 EPS of $17.01 on $18.68 billion of revenue, well ahead of estimates, with equities revenue up 72%. The stock opened up 3.2% at $923 and closed at $891.91, down 0.2%.
Why did Citi stock drop today?
Citi beat on EPS ($2.85 vs $2.66) and revenue and raised its NII guidance, but net income fell 10% from the second quarter and investment banking fees fell 13% sequentially. Shares closed down 5.6%.
When is the October 2026 CPI report?
The September CPI report is released Wednesday, Oct 14, 2026 at 5:30 AM PT (8:30 AM ET).
Did JPMorgan beat earnings?
No. JPMorgan earned $5.57 a share, $5.75 excluding a significant item, which was reported as a rare miss, though net interest income rose 13% to $27.1 billion. The stock closed down 0.9%.
Takeaway
When good earnings get sold, the good news was already in the price. The index held today, but both of its supports wobbled. Wednesday morning decides whether that was a shrug or the first crack.
If you want our free research notes as they land, join the Cos Analyst Signals channel on Telegram: https://t.me/CosAnalystSignals. It is free, and nothing there is financial advice.
BOOK FACT · NOT A TICKET. CosAnalyst research. Not financial advice. Closing prices for $GS, $C, $WFC, $JPM, $SPY, $XLF, $SMH, $MU, the 10-year yield, $WTI and VIX are TradingView prints from about 1:22 PM PT, Tue Oct 13, 2026. Earnings figures are from company releases and filings; estimates are from LSEG and Investing.com as cited.