

In the last few days the number of stocks trading above the 200-day line has actually been increasing. Imagine that. But the number of stocks above the 200-day in the QQQ is still declining, and that is something we have been warning about for the last few months. If the QQQ gets below 50%, roughly 50 of its 100-plus stocks, then we do not have a rally from chips anymore.
Data check: daily closes through Wed Oct 21, 2026 (TradingView INDEX:S5TH, INDEX:NDTH, INDEX:MMTH), pulled 5:50 AM PT Thu Oct 22.
The macro setup
The market underneath the indexes is getting better. The market's leader is getting worse. Since Oct 14:
- S&P 500 above 200d (S5TH): 48.31% to 54.67%, back above 50% for the first time since September.
- All US stocks above 200d (MMTH): 40.33% to 44.01%. Improving, still a minority.
- Nasdaq-100 above 200d (NDTH): 64.35% on Oct 13 to 57.42% on Oct 21. That is about 58 of 101 components, down from about 65. The August peak was 69.6%.
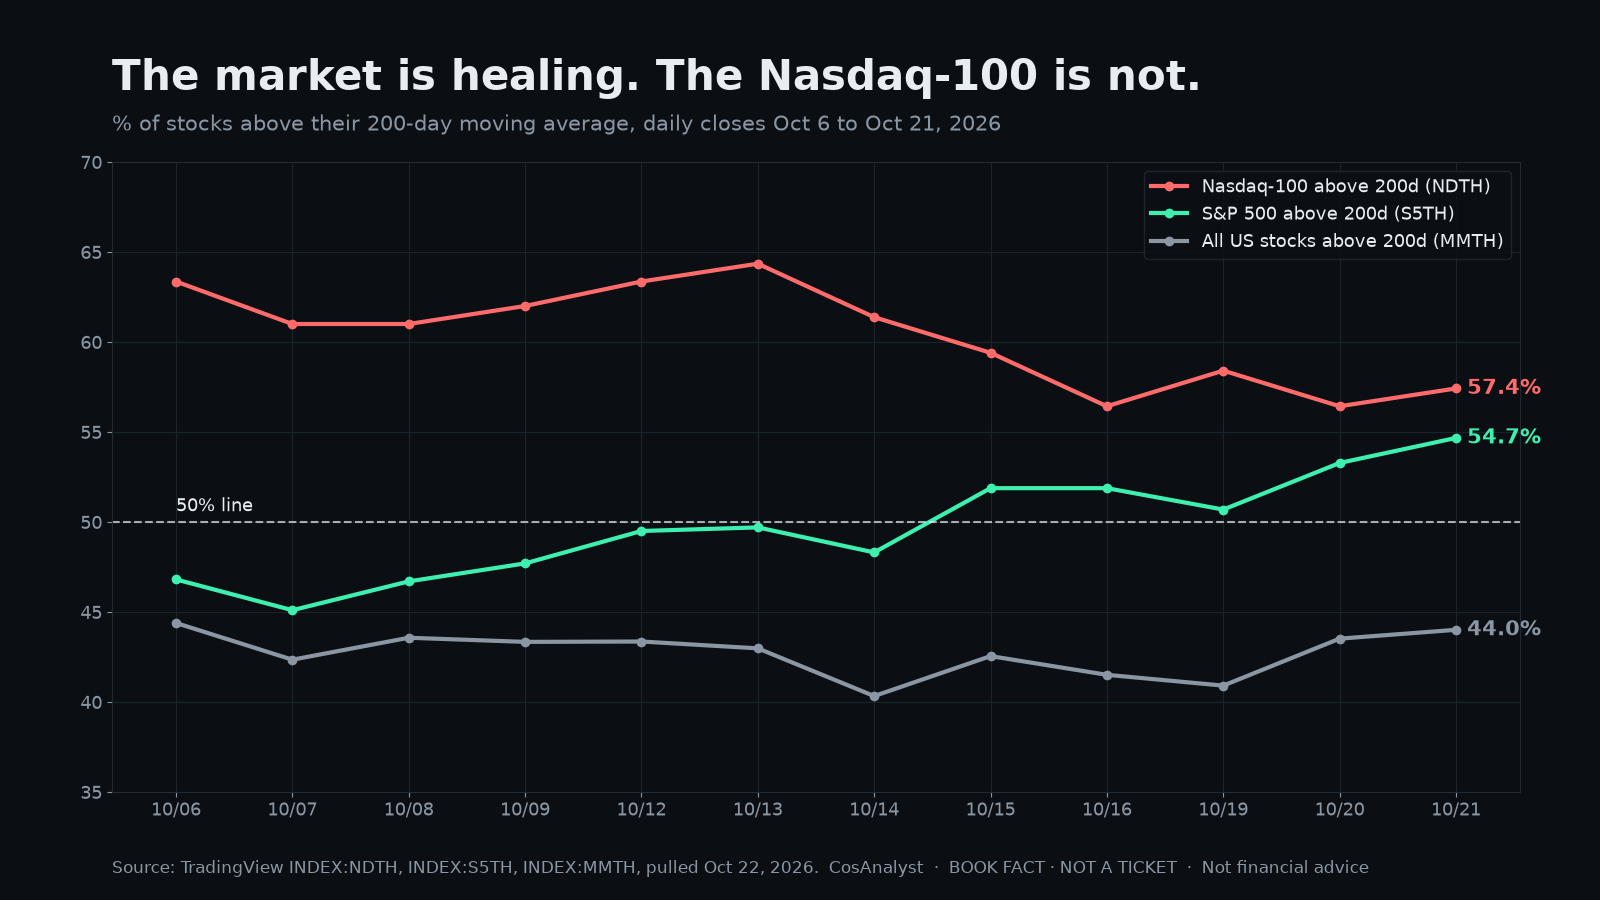
The gap between the Nasdaq-100 and the S&P 500 was about 15 points on Oct 13. It is under 3 points now. One line is climbing toward the other, and the one on top is the one falling.
Five stress signals
- 1. NDTH is down 7 points in six sessions while the broad market rose. About 7 Nasdaq-100 names lost their 200-day in a week where the S&P added breadth.
- 2. Semis are split. Of 24 major chip and chip-software names we checked, 13 are above their 200-day and 11 are below (TradingView, close vs 200-day SMA). The equipment makers $AMAT, $LRCX and $KLAC are all below, as are $AVGO, $NXPI, $ON, $MCHP, $MPWR and $STM. The leaders are holding: $NVDA, $AMD, $MU, $TSM, $MRVL.
- 3. $SMH is lagging. $SMH at 556.70 is -3.4% on the week and -4.3% on the month, and sits under its 50-day (577.56) though well above its 200-day (514.05). The desk's $540 support is the level in focus.
- 4. $QQQ is under its 50-day. $QQQ at 725.20 vs a 726.75 50-day SMA, -1.7% on the week. $XLK is -2.8% on the week.
- 5. Concentration is extreme. Per this morning's desk brief, the top 15 names are a record 46.7% of the index. When that much weight rides on a shrinking list of names above their 200-day, the index can look fine while the floor gets thin. (Concentration figure not independently re-verified for this article.)
If chips don't lead, who does?
We checked the tape rather than assuming the rotation. Week and month performance, TradingView:
- Health care $XLV: +4.7% week, +6.9% month, +11.9% three months. Above its 50-day and 200-day. The clearest new leader.
- Energy $XLE: +0.8% week, +7.9% month, +13.1% three months. Strong trend, oil-driven.
- Financials $XLF: +3.4% week, flat month. Above its 200-day (53.69) and pressing its 50-day (56.04 vs 56.15). Turning up.
- Consumer discretionary $XLY: +3.3% week, +3.6% month.
- Equal-weight $RSP: +1.9% week vs $SPY -0.2%. The average stock is beating the index.
- Industrials $XLI: +0.3% week, -1.2% month, and still below both its 50-day and 200-day (168.31 vs 173.12). Not leading yet.
- Small caps $IWM: +1.1% week, -3.4% month, and still under its 200-day (276.48 vs 278.03). Close, not confirmed.
So the rotation is real in health care and financials, and it is showing up in equal weight. Small caps and industrials are the next test: both need to reclaim the 200-day before we call them leadership.
The if/then
- If NDTH holds above 50% and $SMH holds $540: chips are bruised, not broken. Broad breadth plus a stable QQQ is the healthiest version of this market.
- If NDTH closes below 50% (about 50 names) and $SMH loses $540: we do not have a rally from chips anymore. Leadership has to come from health care, financials and the equal-weight trade, and the cap-weighted indexes likely lag the average stock.
- If S5TH also rolls back under 50%: the broadening was a bounce, not a rotation. That is the risk-off read.
What to watch
- 1. NDTH vs 50% on each close.
- 2. $SMH vs $540, and whether $AMAT, $LRCX, $KLAC can reclaim their 200-days.
- 3. $IWM vs 278 and $XLI vs 173: the confirmation the rotation needs.
- 4. Oct 27 to 28: FOMC.
Takeaway
The average stock is getting healthier. The QQQ is getting narrower. That is fine until the QQQ line hits the 50% floor. Then the question is no longer how high chips can go, it is who carries the market without them. Right now the tape says health care and financials.
Follow @CosAnalyst on X for the morning board and the close. Free research signals, losses included: https://t.me/CosAnalystSignals.
BOOK FACT · NOT A TICKET. CosAnalyst research. Not financial advice. Breadth: TradingView INDEX:S5TH, INDEX:NDTH, INDEX:MMTH daily closes through Oct 21, 2026. Nasdaq-100 component counts are derived from NDTH at 101 components, not a separate count. ETF, sector and semis quotes and 50/200-day SMAs are TradingView marks pulled 5:50 AM PT Oct 22, 2026, reflecting the latest available close. Semis list is our 24-name selection of large chip names, not the official $SMH holdings. Top-15 concentration of 46.7% and $SMH $540 support are from the desk's Oct 22 X brief, not re-verified here.