
Oil is driving the tape today, not the AI trade. The S&P 500 is only down 0.2%, but 348 of its 503 stocks are red, energy and cybersecurity are the only real leaders, and the morning's data said prices are running hot.
Data check: TradingView quotes ~9:48 AM PT / 12:48 PM ET, Fri Oct 23, 2026. Polymarket 9:49 AM PT. CME FedWatch (via Investing.com) 12:25 PM ET. Desk gamma from Cboe delayed chains 12:51 PM ET.
If you looked only at the S&P 500 this morning, you would think it was a quiet Friday. It is not. A war premium is back in crude. Brent is at its highest since April 30 and $WTI is back above $100 as Houthi attacks on Saudi energy sites, including an Aramco facility at Yanbu, and fears of renewed US strikes on Iran hit the oil market (CNBC, Reuters, WSJ). Saudi Aramco evacuated its Dhahran headquarters, and a tanker oil spill off the UAE added to the noise.
That oil shock is landing on the Dow, which was down about 1.1% at 12:06 PM ET (Yahoo Finance); by our 12:48 PM ET read, DIA was -0.90%, while the Nasdaq steadies after Thursday's AI rout.
The tape at midday
- $SPY 762.62, -0.18% (high 763.47, low 758.68, VWAP 761.59). It reclaimed VWAP late morning.
- $QQQ 707.73, +0.46% (high 709.30, low 701.16). It bottomed in the first 15 minutes and is about 0.9% off that low.
- $IWM 276.08, -0.21%, back from a -1.1% low this morning.
- $DIA 523.12, -0.90% (12:48 PM ET). $RSP (equal weight) 217.00, -0.56%.
- Futures: ES 7,687.50 (-0.22%), NQ 29,261.75 (+0.41%), RTY 2,788.0 (-0.29%).
- AP has the S&P 500 on track for a second straight weekly loss.
Oil, rates, dollar, gold, crypto
- $WTI $102.61, +3.2% (range 98.84 to 103.30). Brent $116.10, +2.6% (high 117.41), on track for a third straight weekly gain (CNBC). If you saw "$117 WTI" today, that was the Brent level.
- VIX 19.63, +3.2%. It touched 20+ early, then eased as the Nasdaq bounced.
- 10-year 4.988%, 2-year 4.686%. CNBC: 10Y +3 bp to 4.99%, 30Y +2 bp to 5.31%. The 10Y sits just below 5% after slipping under it Thursday for the first time in a month.
- DXY 101.79, +0.17%.
- Gold $4,018, -1.0%, briefly under $4,000 (low $3,989.1).
- BTC $81,720, +0.4%. ETH $2,409, +0.9%. HYG 76.99, -0.15%.
The breadth problem
The index number is hiding the damage. 155 of 503 S&P 500 stocks are up and 348 are down. Equal-weight RSP (-0.56%) is down about 3x as much as SPY (-0.18%). This is a cap-weighted hold-up, not a broad one.
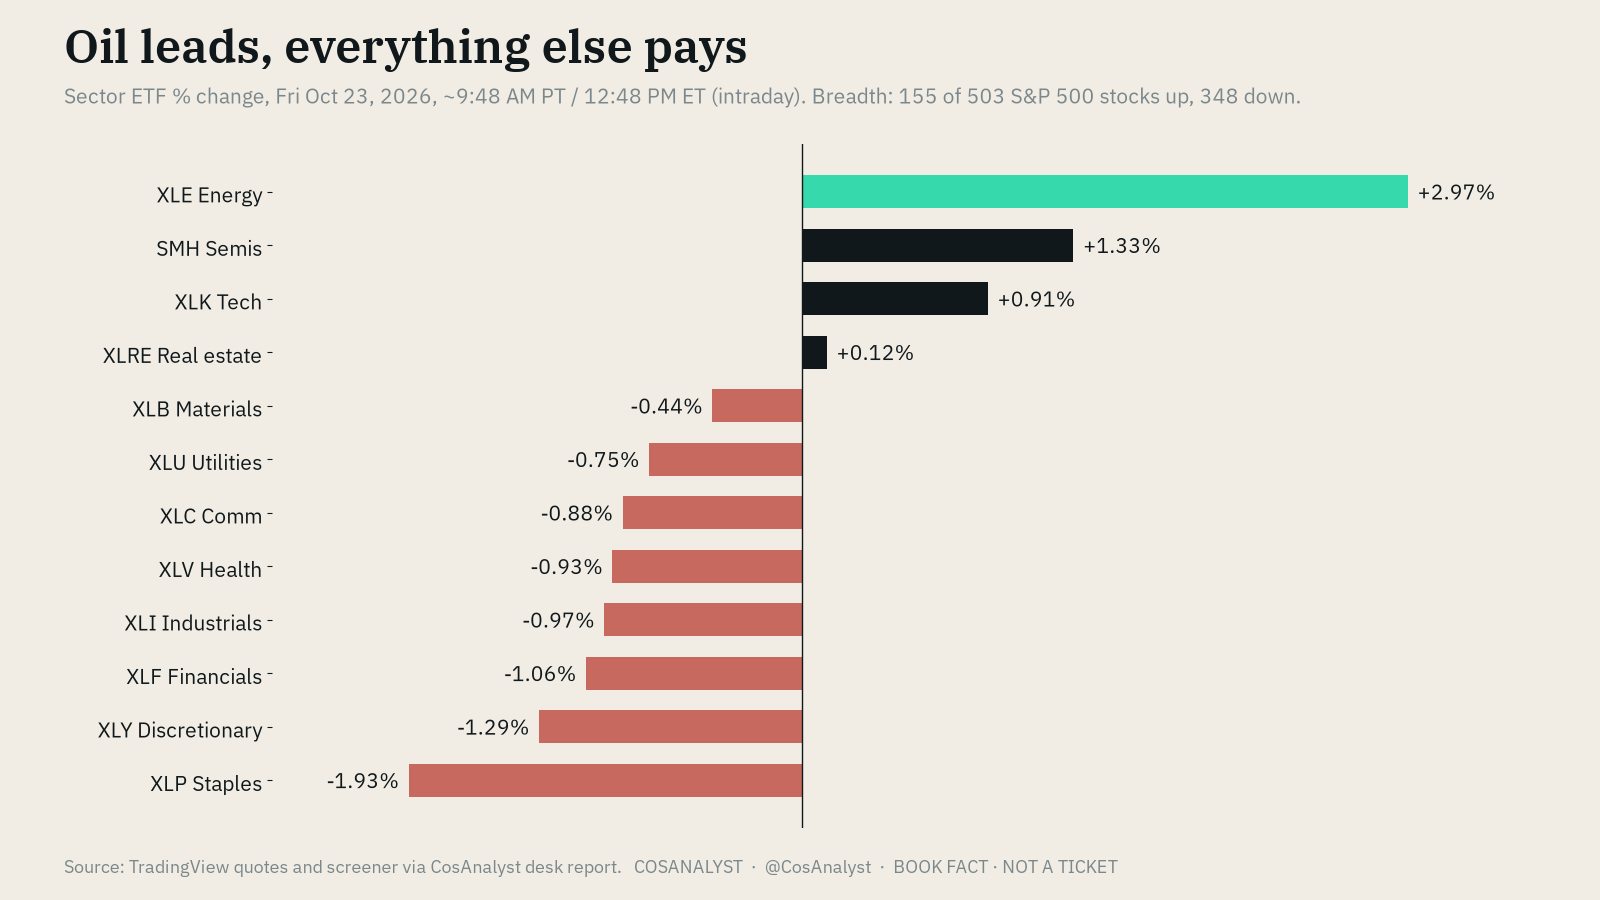
Energy (XLE +2.97%) leads by a mile. Semis (SMH +1.33%) and tech (XLK +0.91%) are partly rebounding from Thursday. Staples (XLP -1.93%), discretionary (XLY -1.29%) and financials (XLF -1.06%) are the laggards.
Hot prices, cool mood
- S&P Global flash PMIs (Oct): manufacturing 56.0 vs 55.5 forecast; services 57.9 vs 58.0; composite 57.6 (prior 58.4). Activity is still strong, but selling prices rose at the fastest rate since August 2022, and new orders grew at their fastest pace in about 4.5 years (S&P Global/Reuters).
- UMich sentiment, final Oct: 48.0 vs 46.3 expected. Year-ahead inflation expectations 4.7% (Sep 4.6%), 5-year 3.5%, both highest since May. 69% of consumers expect rates to rise in the year ahead, the most since April 2023.
What the Fed odds say
- Polymarket (9:49 AM PT): October hold 91.5%, +25 bp 7.5%. December +25 bp 73%, no change 21.5%.
- CME FedWatch (12:25 PM ET): October hike 10.3% (8.0% yesterday, 16.1% a week ago). December one hike 71.1%.
- Read: a hike next week is still a long shot. December is where the hike is priced. The Fed is in blackout through Thu 10/29.
Key levels and dealer gamma (desk estimate)
This is our model from Cboe delayed chains (morning open interest, expiries through Fri 10/30). Treat it as a desk estimate, not a measured fact.
- SPY: net gamma about -$10.7B per 1% move, so dealers are short gamma and moves can extend. Gamma flip ~769.7, about 1% above spot. Big put-gamma strikes at 760 and 755 (then 750); call strikes 770, 775, 780, 783. 760 is the line the street is watching.
- QQQ: net ~-$5.5B per 1%. Flip ~720.9, well above spot. Heavy put gamma at 711 and 700, which bracket today's 701 to 709 range.
- IWM: net ~-$0.75B. Flip ~277.8, just above spot. Put strikes 277/275, call 280.
- Put/call volume: SPY 1.21, QQQ 1.05, IWM 2.01 (IWM is put-heavy).
Movers
Up
- Crown Castle (CCI) +9.4%, the S&P's top gainer; American Tower +3.1%. Bloomberg via Reuters: SpaceX is seeking access to about 80,000 US cell sites for a Starlink-based wireless network, including talks with Crown Castle. No lease is confirmed.
- SLB +7.5% on a Q3 beat (adj EPS $0.64 vs $0.62, revenue $9.45B vs $9.27B). HAL +6.0%, APA +5.7%, DVN +4.8%, COP +4.4%, XOM +2.6%, CVX +2.8% on oil.
- Cyber: PANW +6.6%, CRWD +6.4%, OKTA +5.2%, after Deutsche Bank named PANW, CRWD and Snowflake as winners from rising AI token usage.
- Chip bounce: MU +3.4%, AMD +1.7%, INTC +1.7%. DDOG +5.3%.
Down
- Bloom Energy (BE) -12.1%, worst in the S&P. It beat and raised (revenue $1.24B, +138% y/y; FY guide $4.4B to $4.6B), but about $180M of negative cash flow on record capex sparked a sell-the-news drop.
- Comfort Systems (FIX) -8.1%: no 2027 guidance and its CFO is retiring.
- Globe Life (GL) -7.6%: EPS miss, lowered guidance, Piper Sandler downgrade.
- Carriers on the SpaceX report: AT&T -5.9%, T-Mobile -5.7%, Verizon -1.2%.
- American Express (AXP) -3.7%: revenue and network volume missed, about 3,500 job cuts. A top Dow drag.
- Megacaps mixed: MSFT +0.8%, NVDA ~flat, AAPL -0.3%, AMZN -0.3%, GOOGL -0.3%, META -0.5%, TSLA -0.5%.
Free channel receipts: Hawk and Fox
From the public log at t.me/CosAnalystSignals, through ~9:50 AM PT. The channel posted no outcome receipts today, so these are desk-graded against TradingView 1-minute bars, gross of costs. Duplicate posts counted once.
Closed: 5 trades, 2 wins / 3 losses, net +5R.
- WIN +4R. Hawk RTY1! 5m premarket short, posted 1:32 AM PT. Entry 2790.95, stop 2794.10, target 2778.35 hit 3:52 AM PT.
- WIN +4R. Hawk RTY1! 5m premarket short, posted 5:21 AM PT. Entry 2781.15, stop 2783.30, target 2772.55 hit 6:33 AM PT, into the cash open.
- LOSS -1R. Hawk NQ1! 5m RTH short, posted 6:42 AM PT. Entry 29121.50, stop 29145.50, stopped 6:45 AM PT.
- LOSS -1R. Hawk QQQ 5m RTH put, posted 6:44 AM PT. Entry 704.35, stop 704.90, stopped 6:45 AM PT as QQQ ripped off its 701.16 low.
- LOSS -1R (forward test). Fox NQ1! 5m long, posted 7:10 AM PT. Entry over 29169.75, stop 29081.19, stopped 7:27 AM PT, just before NQ rallied. T1 was reached after the stop.
Open (marked ~9:50 AM PT):
- Hawk QQQ 15m call, entry 703.30, target 711.90. Stop moved to breakeven; mark 707.73 = +2R open, now risk-free.
- Also open: Hawk NQ1! 15m long (forward test, stop at breakeven, +2.06R), Fox ES1! long (+0.09R), Fox RTY1! long (+0.35R).
The honest read: the premarket small-cap shorts nailed the risk-off open, the first-bar shorts got run over by the Nasdaq reversal, and the 15-minute longs caught that reversal.
BOOK FACT · NOT A TICKET. These are public alert outcomes, graded by the desk. They are not advice and not a trade for you to copy.
A note on research: our swing edge loop and scalp lab have no new runs on file for Oct 21 to 23. The latest are from Tue Oct 20, and we are not presenting them as today's work.
What's next (PT)
- Today: cash close 1:00 PM PT. Watch oil headlines (US-Iran, Houthi/Saudi) into the weekend.
- Tue 10/27: FOMC meeting begins; durable goods and consumer confidence.
- Wed 10/28: Fed decision 11:00 AM PT, press conference 11:30 AM PT. Microsoft and Alphabet report after the close.
- Thu 10/29: Q3 GDP and September PCE at 5:30 AM PT. Amazon reports after the close. Fed blackout ends.
- Fri 10/30: Employment Cost Index.
- Mon 11/2: Apple after the close.
FAQ
As of ~9:48 AM PT / 12:48 PM ET, Fri Oct 23, 2026 (TradingView quotes; Polymarket 9:49 AM PT; CME FedWatch 12:25 PM ET).
Why is oil going up today?
A war premium is back in crude. Houthi attacks on Saudi energy sites, including an Aramco facility at Yanbu, and fears of renewed US strikes on Iran pushed oil higher (CNBC, Reuters, WSJ). Saudi Aramco evacuated its Dhahran headquarters, and a tanker oil spill off the UAE added to the pressure on supply sentiment.
Is WTI crude oil above $100 today?
Yes. WTI traded at $102.61, up 3.2%, in a range of 98.84 to 103.30. Brent was $116.10, up 2.6%, with a high of 117.41, its highest level since April 30 and on track for a third straight weekly gain (CNBC). Any "$117" quote seen today was the Brent level, not WTI.
How is the stock market doing today with oil above $100?
The Dow was down about 1.1% (Yahoo Finance, 12:06 PM ET), and DIA was down 0.90% (12:48 PM ET). SPY was down only 0.18%, while QQQ rose 0.46%. Breadth was weak: 155 of 503 S&P 500 stocks were up and 348 were down, and equal-weight RSP fell 0.56%.
How are oil stocks and the XLE ETF doing today?
The energy sector ETF, XLE ETF, rose 2.97% and led all sectors. SLB gained 7.5% after a Q3 beat, with HAL up 6.0%, APA up 5.7%, DVN up 4.8%, COP up 4.4%, CVX up 2.8% and XOM up 2.6%. Staples were the weakest sector, with XLP down 1.93%.
What are the Fed rate hike odds after today's data?
Polymarket showed a 91.5% chance of an October hold and 7.5% for a 25 bp hike, with a December hike at 73%. CME FedWatch put an October hike at 10.3% and one December hike at 71.1%. The Fed decision is Wed 10/28 at 11:00 AM PT.
Did today's economic data show rising inflation?
Yes. The S&P Global October flash PMI showed selling prices rising at the fastest rate since August 2022, with manufacturing at 56.0 versus 55.5 forecast. Final October UMich sentiment was 48.0, and year-ahead inflation expectations rose to 4.7% from 4.6%, with 5-year expectations at 3.5%, both highest since May.
Bottom line
Oil set the tone today, and the index is hiding how many stocks are falling. Hot price data plus $100 crude keeps the "hike in December" story alive. Our levels for the rest of the day: SPY 760 below, the ~769.7 gamma flip above.
Follow @CosAnalyst on X for the close recap, and join our free Telegram channel @CosAnalystSignals to see Hawk and Fox alerts in real time, losses included.
Sources: TradingView; Polymarket; CME FedWatch via Investing.com; Cboe delayed chains (desk model); Yahoo Finance; AP; WSJ; CNBC; Reuters via Investing.com; Motley Fool; University of Michigan; S&P Global; MarketWatch; Forbes; The National; t.me/s/CosAnalystSignals.