
A theory spread fast this cycle: that big donors, PACs or NGOs were pouring money into Democratic "sweep" bets on Polymarket to make a blue wave look inevitable and discourage Republican turnout. Grant Cardone said on X he is "convinced Democrats are using political funds to manipulate Polymarket odds" (post) and later called it "election interference" (post). We pulled the public on-chain record to test the claim.
Verdict: inconclusive on who, not supported on how. On-chain data cannot tell us who owns a wallet, so we can't prove or rule out that a donor, PAC or NGO is behind any account. But the patterns the theory predicts did not show up in what we could measure.
Is big money on Polymarket swaying the midterms? The short answer
The D-side dollar lead mostly reflects Democrats being the favorite, since favorites cost more per share. R-side buyers actually bought more shares. Large wallets on both sides are mostly seasoned and multi-market. Three of the four shared funding sources look like public infrastructure used by both sides. Big trades didn't leave lasting price moves, and Polymarket stayed within a few points of Kalshi, a separate US-regulated exchange.
1. Follow the money, three ways
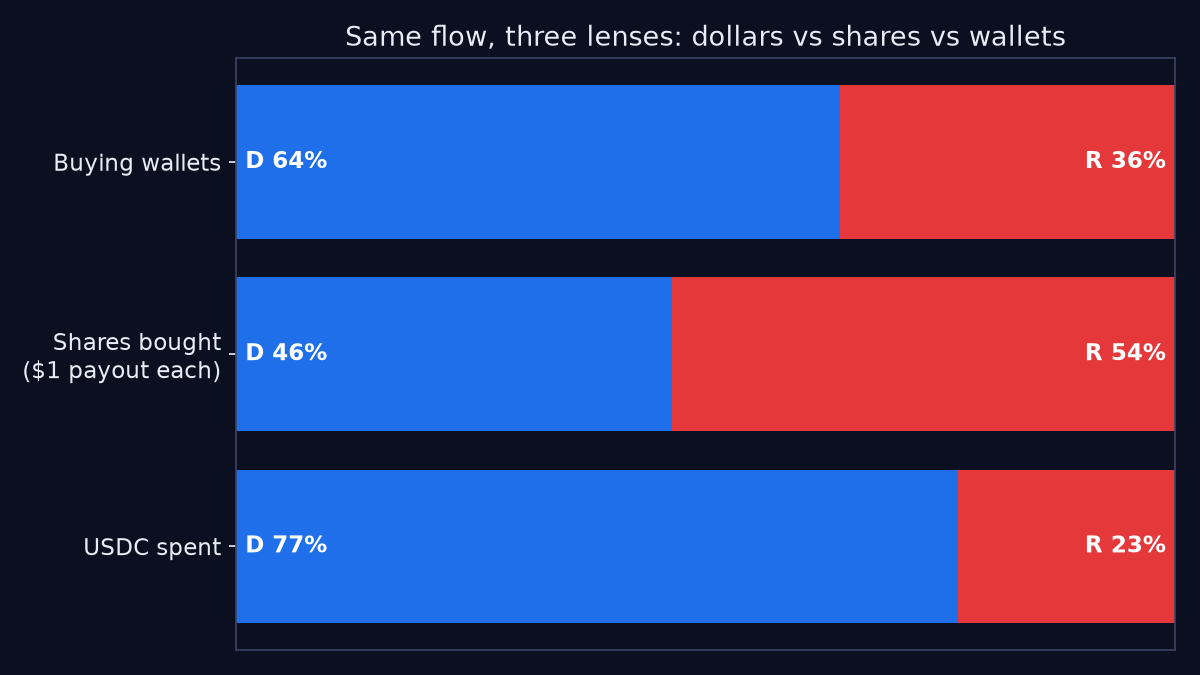
Across the 11 largest House/Senate control, sweep and marquee Senate markets, traders bought $34.9M of D-side positions and $10.5M of R-side positions before Election Day. Dollars alone exaggerate the gap. A share pays $1 if it wins, and Democrats were priced as the favorite (House around 94%, Senate around 75% the day before), so each D share cost more. Counted in shares, which measures what each side stands to win or lose, R-side buyers took 51.4M shares against 44.5M for D-side buyers. D-side buyers outnumbered R-side buyers, 26,273 wallets to 14,589.
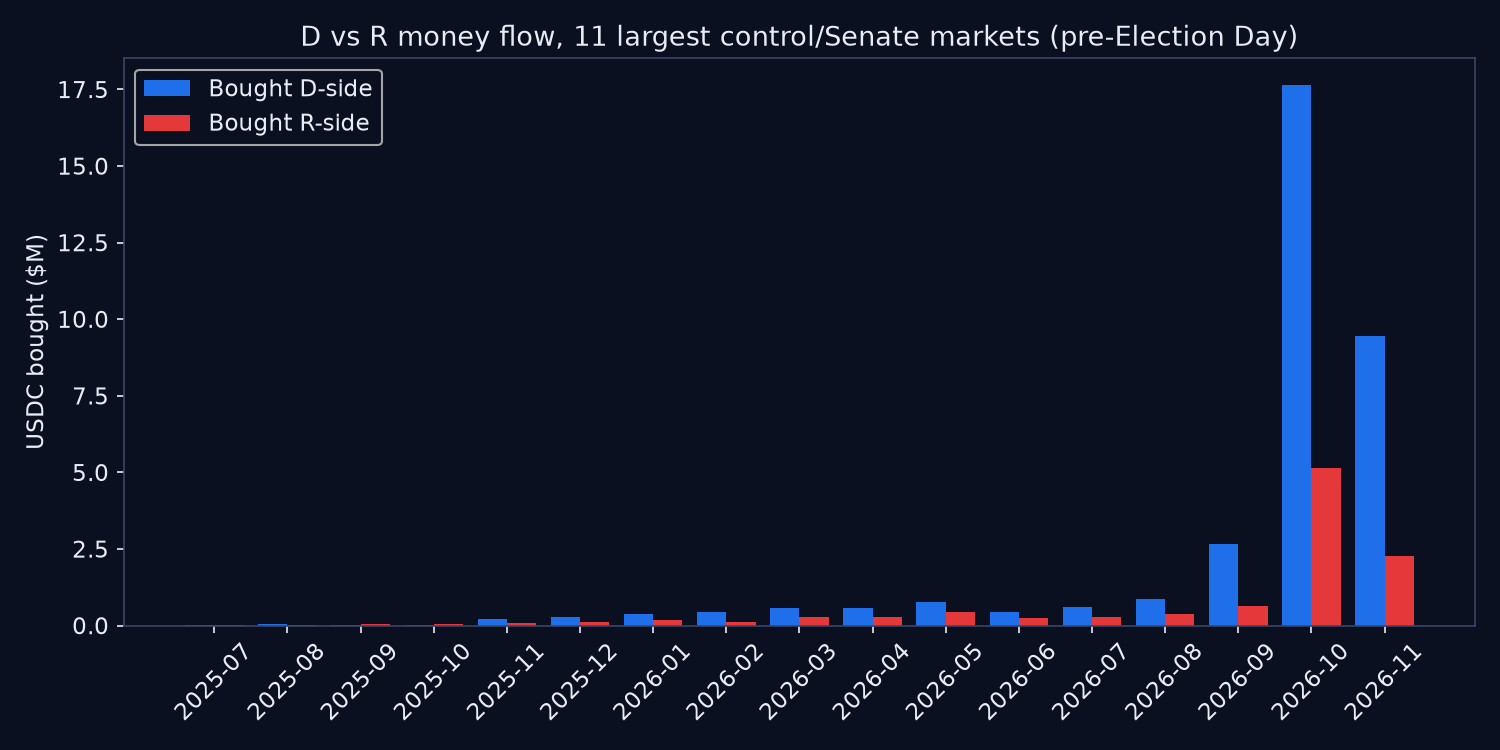
On Election Day itself another $18.6M went to the D side, much of it after results began coming in.
2. Who are the whales? New vs seasoned
We flagged every wallet that bought at least $10k in these markets before Election Day: 634 wallets, 502 leaning D ($28.5M) and 132 leaning R ($6.1M). For each one, we found its first-ever Polymarket activity. Freshly created accounts are sometimes cited as a possible sign of coordination, though they prove nothing on their own.
| D-leaning | R-leaning | |
|---|---|---|
| New (first activity 60 days ago or less) | 76 of 502 (15%) | 24 of 132 (18%) |
| Dollars from new wallets | $3.4M (12%) | $1.8M (30%) |
| Median wallet age | 342 days | 331 days |
| Election-focused (90%+ of recent activity political) | 49 (10%) | 15 (11%) |
| Median distinct events traded (recent history) | about 66 | 29 |
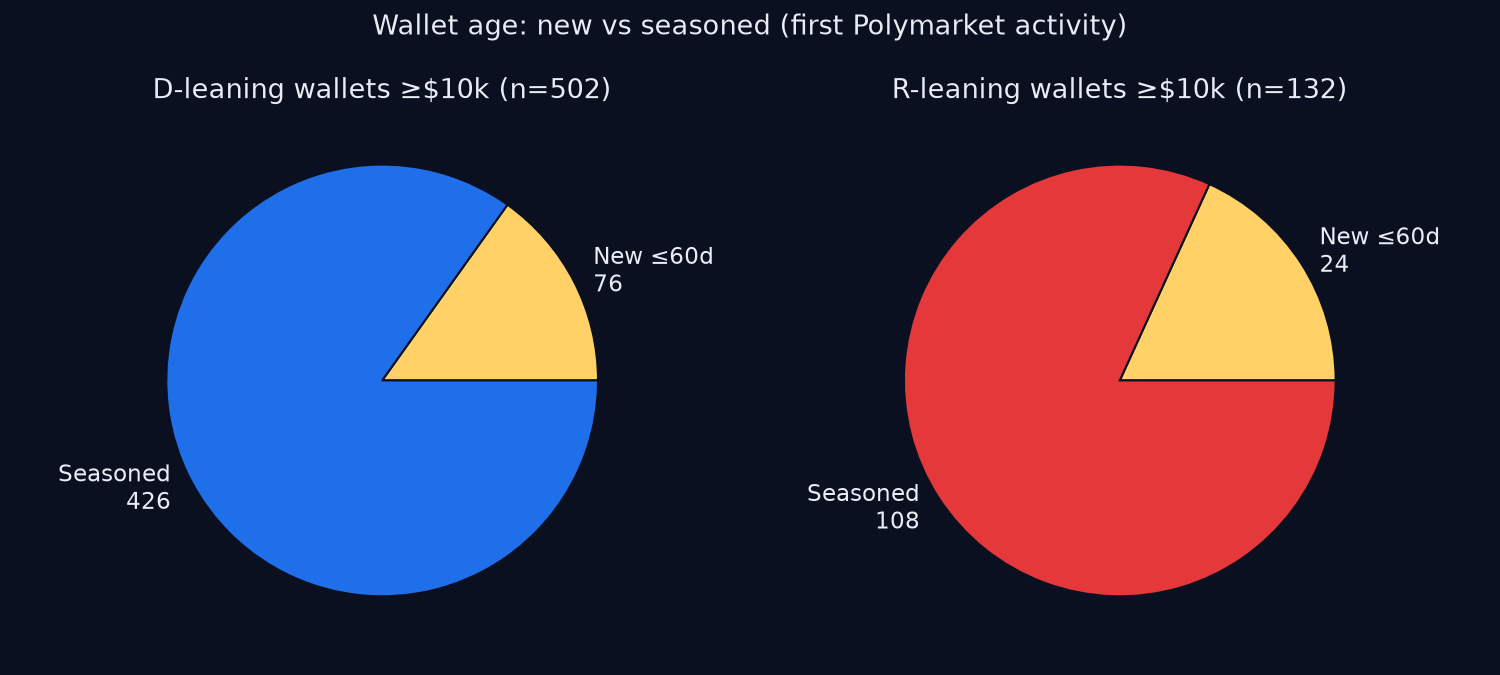
New money showed up on both sides, and it was actually a bigger share of R-side dollars. The largest brand-new whale in our set (Wallet F, first active 13 days before the election) bet the R side. In both camps, the typical large wallet had nearly a year of history across dozens of events, which looks more like regular traders than single-use accounts. 93 of the 634 large wallets bought meaningful amounts on both sides, a pattern consistent with hedging or market-making.
3. Concentration: is one giant moving the board?
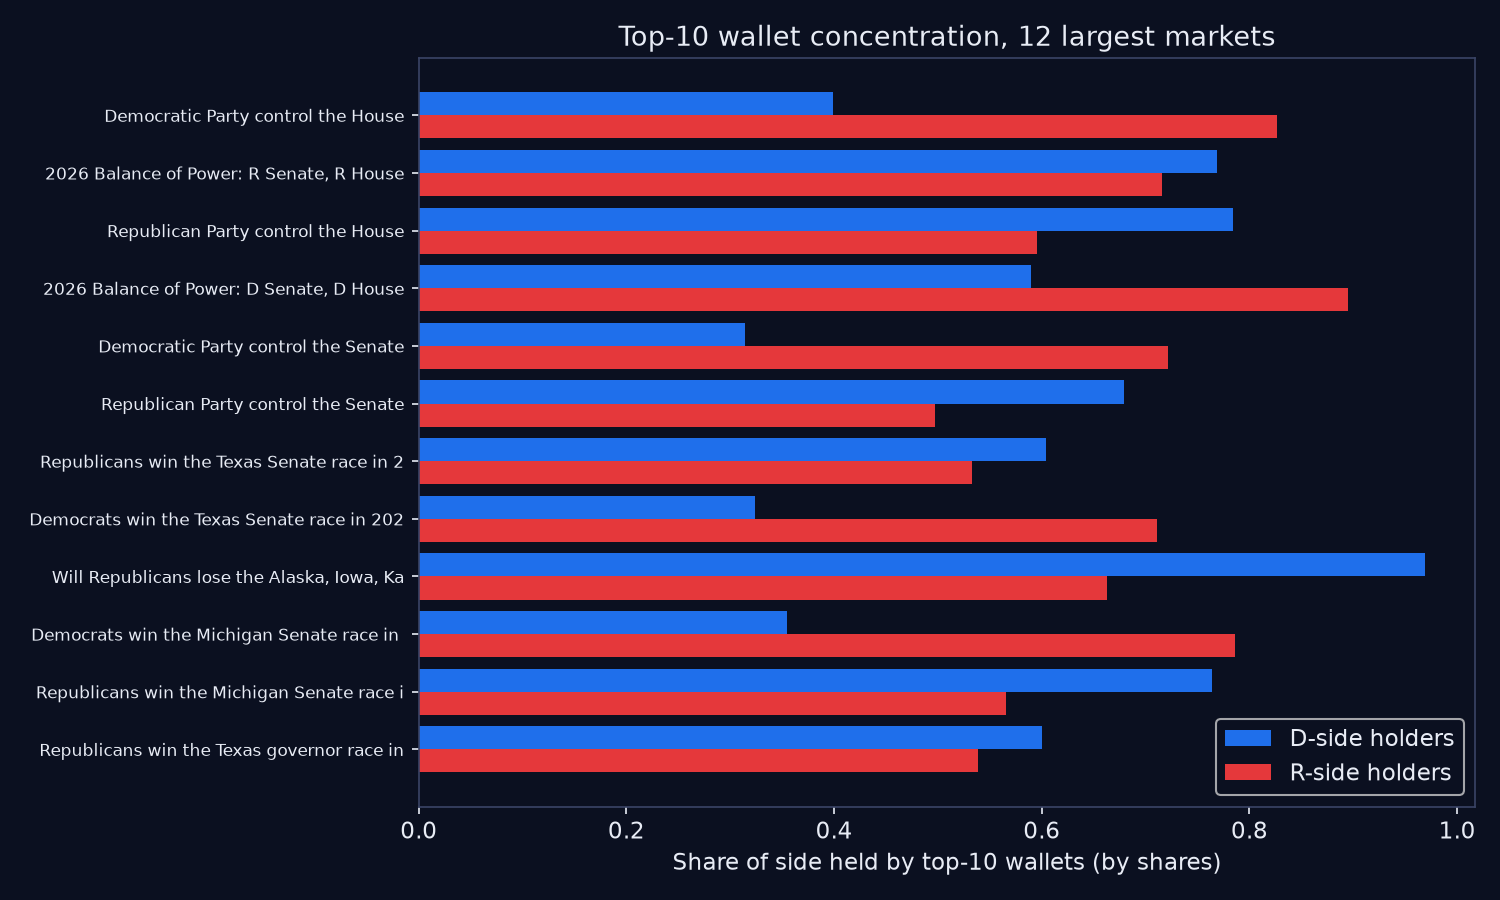
We ranked the holders of every market with at least $1M in volume (40 markets) by shares held. The median top-10 share was 71% on the D side and 73% on the R side, with Gini coefficients of 0.94 and 0.95. Both sides are top-heavy to about the same degree, which is normal for prediction markets. Among large D-leaning wallets, the top 10 accounted for 21% of large-wallet D dollars. On the R side, the top 10 accounted for 47%. By this measure, R-side money was more concentrated.
4. Funding trails: one hidden bankroll?
For the 60 largest wallets, we scanned Polygon for the USDC transfers that arrived in the roughly 2,000 blocks (about an hour) before each wallet's first trade. We identified a funding source for 51 of the 60. Four sources appeared more than once:
| Funder | Wallets funded | D-leaning | R-leaning |
|---|---|---|---|
| Token mint (0x0) | 13 | 9 | 4 |
| High-throughput hot wallet (3.3M txs) | 9 | 7 | 2 |
| 0xf0fc…f52e | 3 | 2 | 1 |
| Large contract (22KB code) | 11 | 11 | 0 |
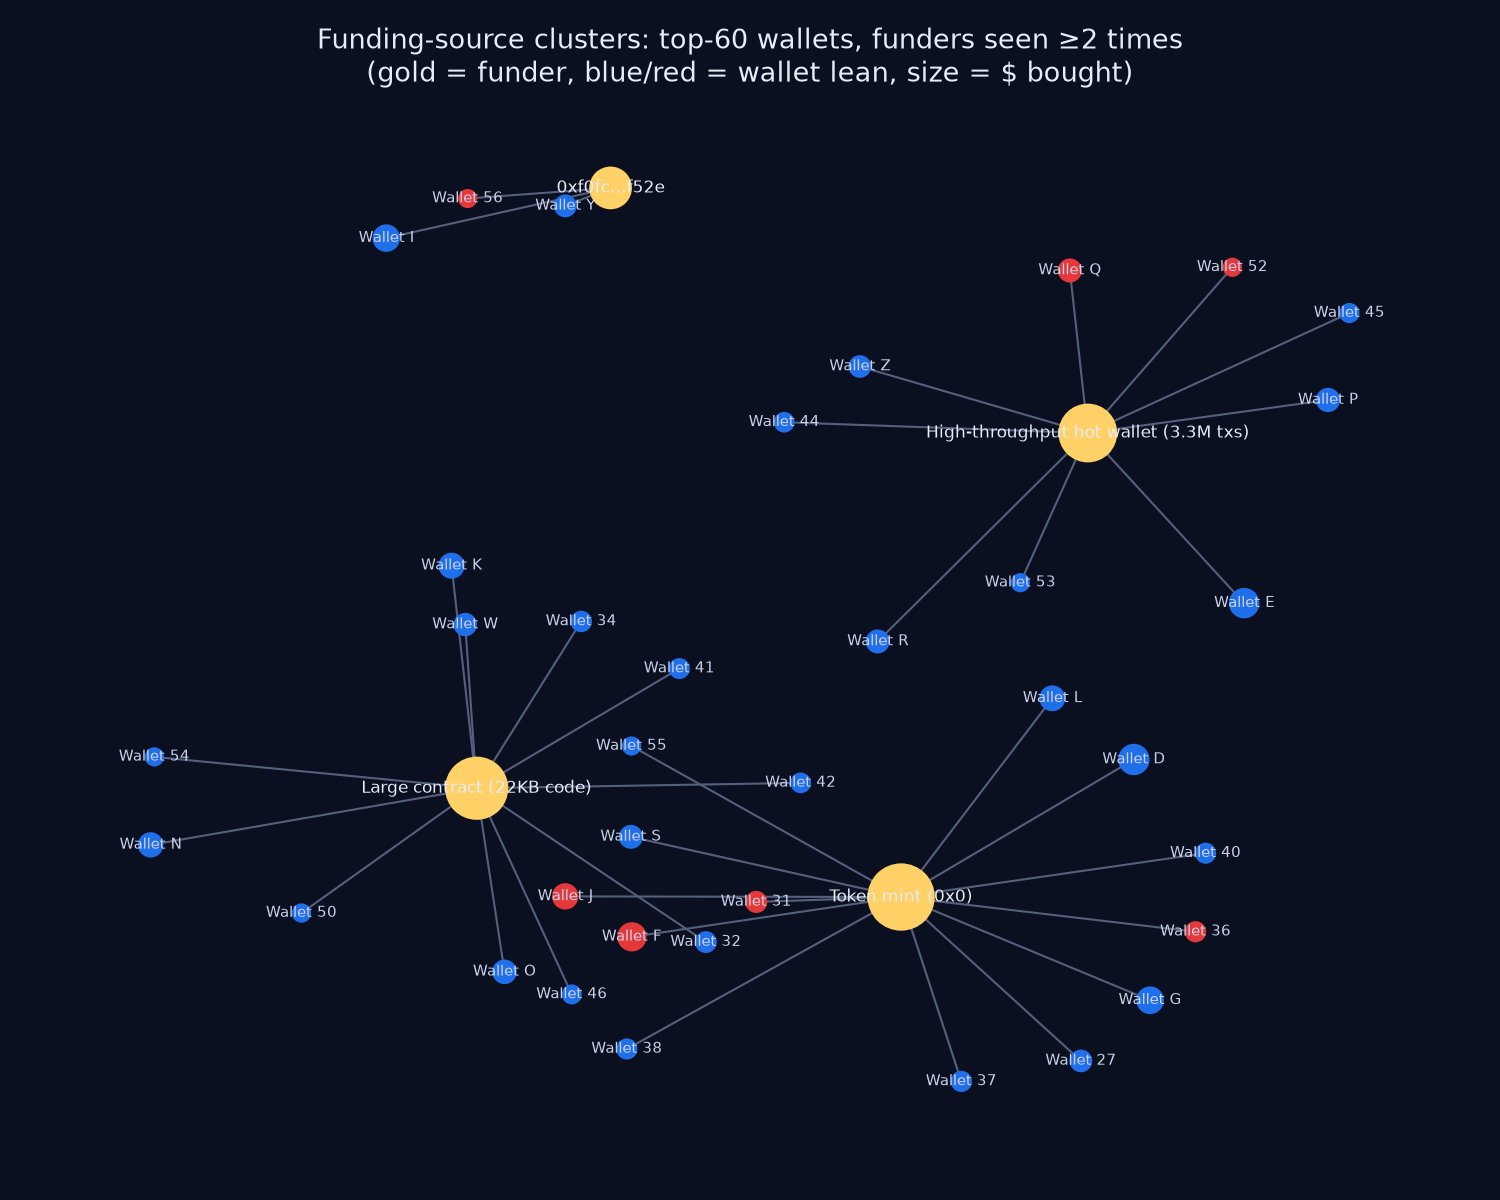
Three of the four shared sources look like public infrastructure: the token mint, a hot wallet with about 3.3 million transactions (per its Polygon transaction count), and a busy routing contract that in a roughly 17-minute sample paid out to 8 distinct recipients. That routing contract funded 11 D-leaning wallets and no R-leaning ones, but its wide payout pattern looks like shared infrastructure rather than one person's bankroll. The fourth source looks like a private address. It funded only 3 wallets, two D-leaning and one R-leaning, so any read on it rests on those 3 wallets, and that mix doesn't fit a single partisan cluster. Exchange and bridge deposits break the trail, so these hops can't show who ultimately supplied the money.
5. Timing and price impact: pushed, then abandoned?
A manipulation campaign usually leaves a footprint: a big buy pushes the price, then nobody defends it and it falls back. In the D-House market, we checked every fill of at least $50k against the price before it and 1 hour and 24 hours after. Across 31 measurable fills, the median move in the trade's direction was 0.0 points at both 1 hour and 24 hours. The market absorbed the big trades without being pushed. We found 16 ten-minute windows where three or more large wallets each bought at least $10k on the D side, and 1 such window on the R side. That is a lead worth noting, but large D-leaning wallets also outnumbered R-leaning ones about 4 to 1, and these bursts didn't leave sustained price moves.
6. Did Polymarket drift from other markets?
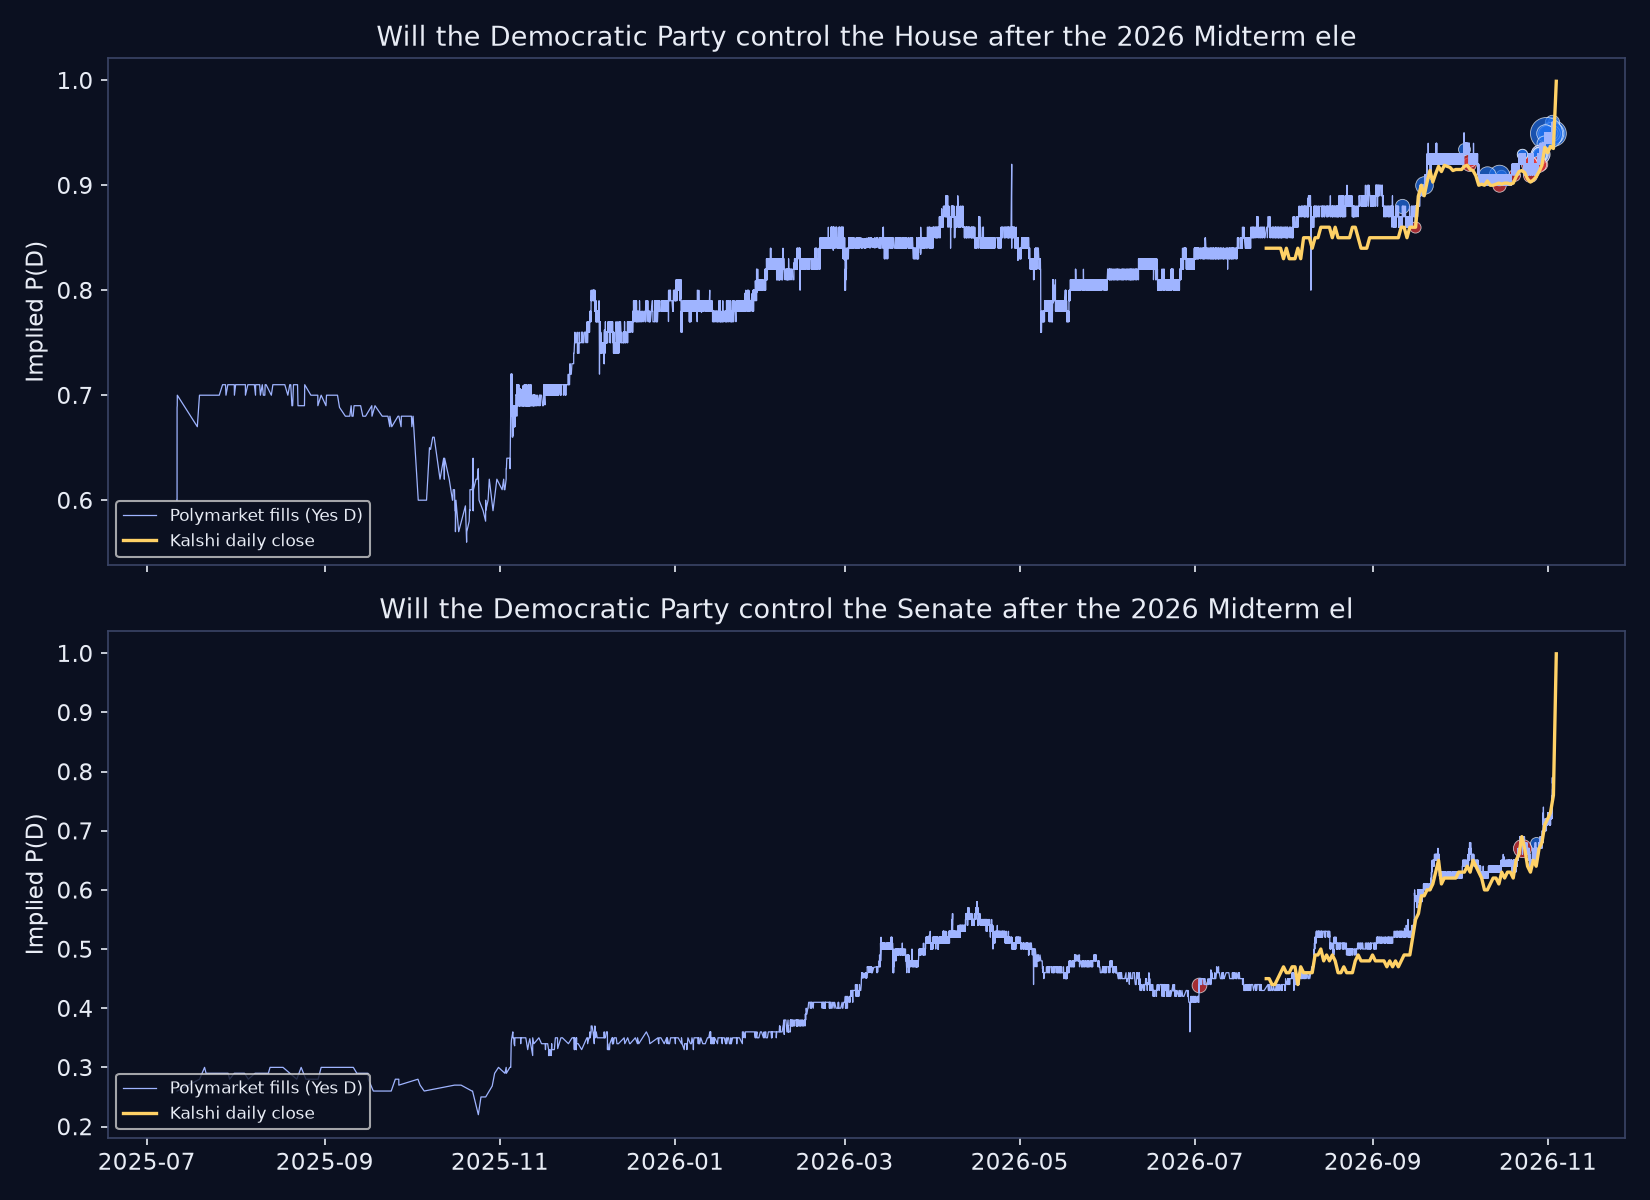
If Polymarket's odds were being propped up, they should drift away from other venues. Over the final 60 days, Polymarket's daily D-Senate price ran an average of 2.0 points above Kalshi's daily close (largest gap 6 points). For D-House, the average was 1.3 points above (largest gap 3 points). That's a small, steady Democratic lean, and the two snapshots are taken at slightly different times of day. On the day before the election, the venues were about half a point apart on the Senate (75.5% on Polymarket's last fill of the day vs 76% at Kalshi's daily close, both from the venues' public APIs). As of Nov. 3 evening PT, both venues showed Democrats at about 99.9% for House and Senate control. We didn't compare against polling averages in this pass.
What on-chain data can and can't tell you
- Can show: wallet sizes, timing, which side each wallet bought, account age, how many kinds of markets it trades, the funding hops just before its first trade, and how prices reacted.
- Can't show: who owns a wallet. A donor, PAC, NGO, hedge fund or retiree all look the same on-chain, and exchange or bridge deposits break the trail. Nothing here shows anyone's intent, or whether any trader meant to influence voters.
- Access: Polymarket International states that US persons are prohibited from trading there. US traders are directed to Polymarket US, a CFTC-designated exchange operated by QCX LLC. Polymarket US trading happens off this chain and isn't covered here.
- Coverage: trade-level data covers the 11 largest markets. Holder snapshots cover all 1,483. Funding traces cover the top 60 wallets. Recent-activity breadth is capped at 2,000 records per wallet. Listed volume counts differently from the dollar totals of filled trades.
Bottom line
The public record can't prove or disprove who's behind any wallet, so the donor/PAC/NGO question is inconclusive. The specific pattern the theory predicts doesn't show up in the data we measured: one-sided new-wallet floods, a shared partisan bankroll, price pushes that fade, or a gap from other markets. The D-side dollar lead is consistent with Democrats being the favorite, and that favorite status matched both Kalshi and the results as they came in on election night.
Evidence appendix
Downloads: markets.csv (every market and side: volume, holders, top-10 share, Gini, source URL) · big_wallets.csv (634 large wallets, shortened addresses).
Top 20 markets by listed volume. Source: Polymarket Gamma API.
| Label | Lean | Bought D / R | Age | Wallet | Proof |
|---|---|---|---|---|---|
| Wallet A | D | $1,089k / $250k | 222d | 0xfea3…d227 | first trade · funding tx |
| Wallet B | D | $774k / $456k | 218d | 0xdc41…dd7e | first trade · funding tx |
| Wallet C | D | $846k / $0k | 503d | 0xc4d1…8ce8 | first trade · funding tx |
| Wallet D | D | $492k / $177k | 209d | 0x2b59…9db6 | first trade · funding tx |
| Wallet E | D | $623k / $0k | 413d | 0x9c99…7250 | first trade · funding tx |
| Wallet F | R | $0k / $560k | 13d (new) | 0x60bf…942d | first trade · funding tx |
| Wallet G | D | $483k / $0k | 42d (new) | 0xf4c9…f88c | first trade · funding tx |
| Wallet H | D | $476k / $0k | 1017d | 0xed10…d2e5 | first trade · funding tx |
| Wallet I | D | $469k / $5k | 486d | 0x212f…7fd2 | first trade · funding tx |
| Wallet J | R | $0k / $424k | 126d | 0x3a6a…458e | first trade · funding tx |
| Wallet K | D | $408k / $0k | 736d | 0x1489…1307 | first trade · funding tx |
| Wallet L | D | $334k / $67k | 174d | 0x032e…2a9e | first trade · funding tx |
| Wallet M | D | $389k / $0k | 341d | 0x4b29…716f | first trade · n/a |
| Wallet N | D | $358k / $20k | 754d | 0x4488…e319 | first trade · funding tx |
| Wallet O | D | $345k / $0k | 756d | 0x7f9e…3a0e | first trade · funding tx |
Top 15 wallets by pre-Election-Day dollars bought. Labels are assigned by those dollars. Links go to Polygonscan.
FAQ
Did Democrats buy Polymarket odds to sway the midterms?
The public data can't say who owns any wallet, so that question is inconclusive. The footprints a campaign like that would usually leave (one-sided new-wallet floods, a shared partisan bankroll, pushed-then-abandoned prices, drift from Kalshi) did not show up in our measurements.
Why was so much more money on the Democratic side?
Democrats were the favorite, so each D share cost more. Counted in shares, R-side buyers actually bought more.
Sources and disclaimer
Disclaimer: This article is for informational and educational purposes only. It is not financial, betting or political advice, and nothing here guarantees any outcome. On-chain data shows transactions, not identities or intent.
Follow @CosAnalyst on X for more data-led market breakdowns.
Your call: Is it fair to call big prediction-market bets election interference, or is a favorite simply costing more to back? Pick a side in the comments.