
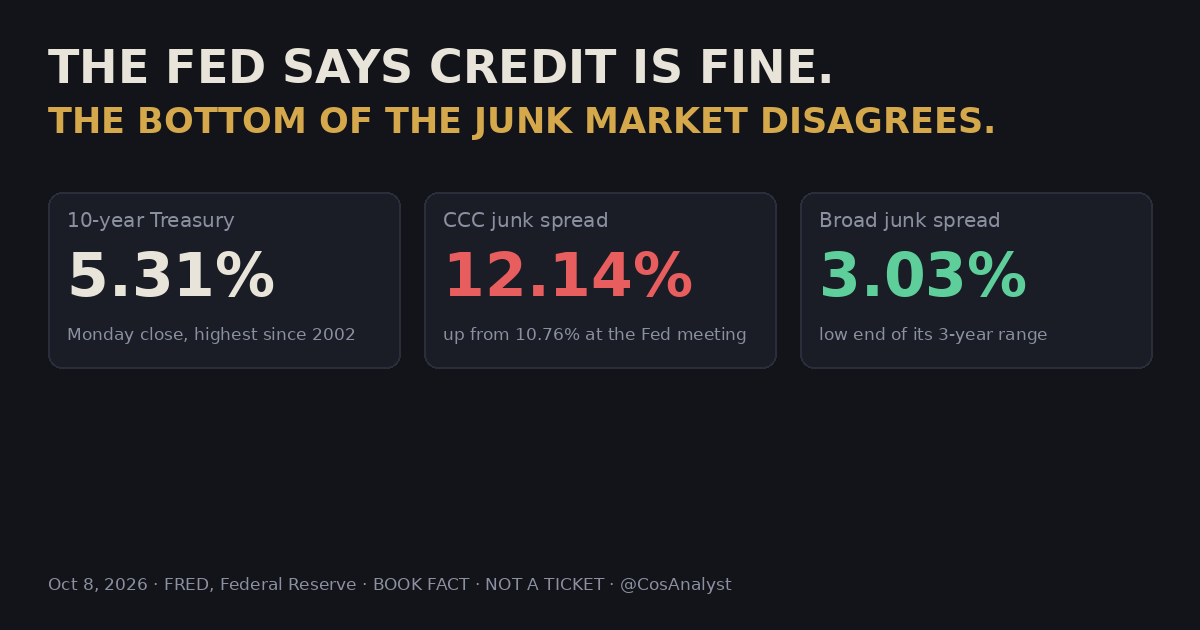
Save this one. It's the chart we'll keep coming back to this fall. The Fed's own minutes, out Wednesday, say financial conditions still look fine. Underneath that average, the weakest companies in America are paying more to borrow than at any point in three years.
As of Thu Oct 8, 2026, 1 AM PT. Spreads, Treasury yields and mortgage rates are from FRED (ICE BofA, U.S. Treasury, Freddie Mac). Fed quotes are from the Sep 15-16 FOMC minutes. Prices are Yahoo Finance. Fed odds are from Polymarket, a prediction market.
The setup
The 10-year Treasury yield closed at 5.31% on Monday. That's the highest close since May 2002. It finished Wednesday near 5.28%.
The dollar is climbing with it. The dollar index (DXY) was 100.22 on Sep 18 and is 102.30 overnight. When yields and the dollar rise together, borrowing gets more expensive for almost everyone, here and abroad.
The Fed raised its rate to 3.75% to 4% in September. Wednesday's minutes said most officials see another hike as likely by year-end. Polymarket puts a December hike at 73.5%.
Then comes the line that matters. In the minutes' words: "Many participants commented that, despite the recent rise in longer-term Treasury yields, financial conditions appeared to be supportive of economic growth, with equity prices having risen substantially this year and spreads on corporate bonds having remained narrow."
That describes a meeting held Sep 15-16, when the 10-year was 5.01%. Here's what has moved since, and what was already cracking.
What's underneath: five signals
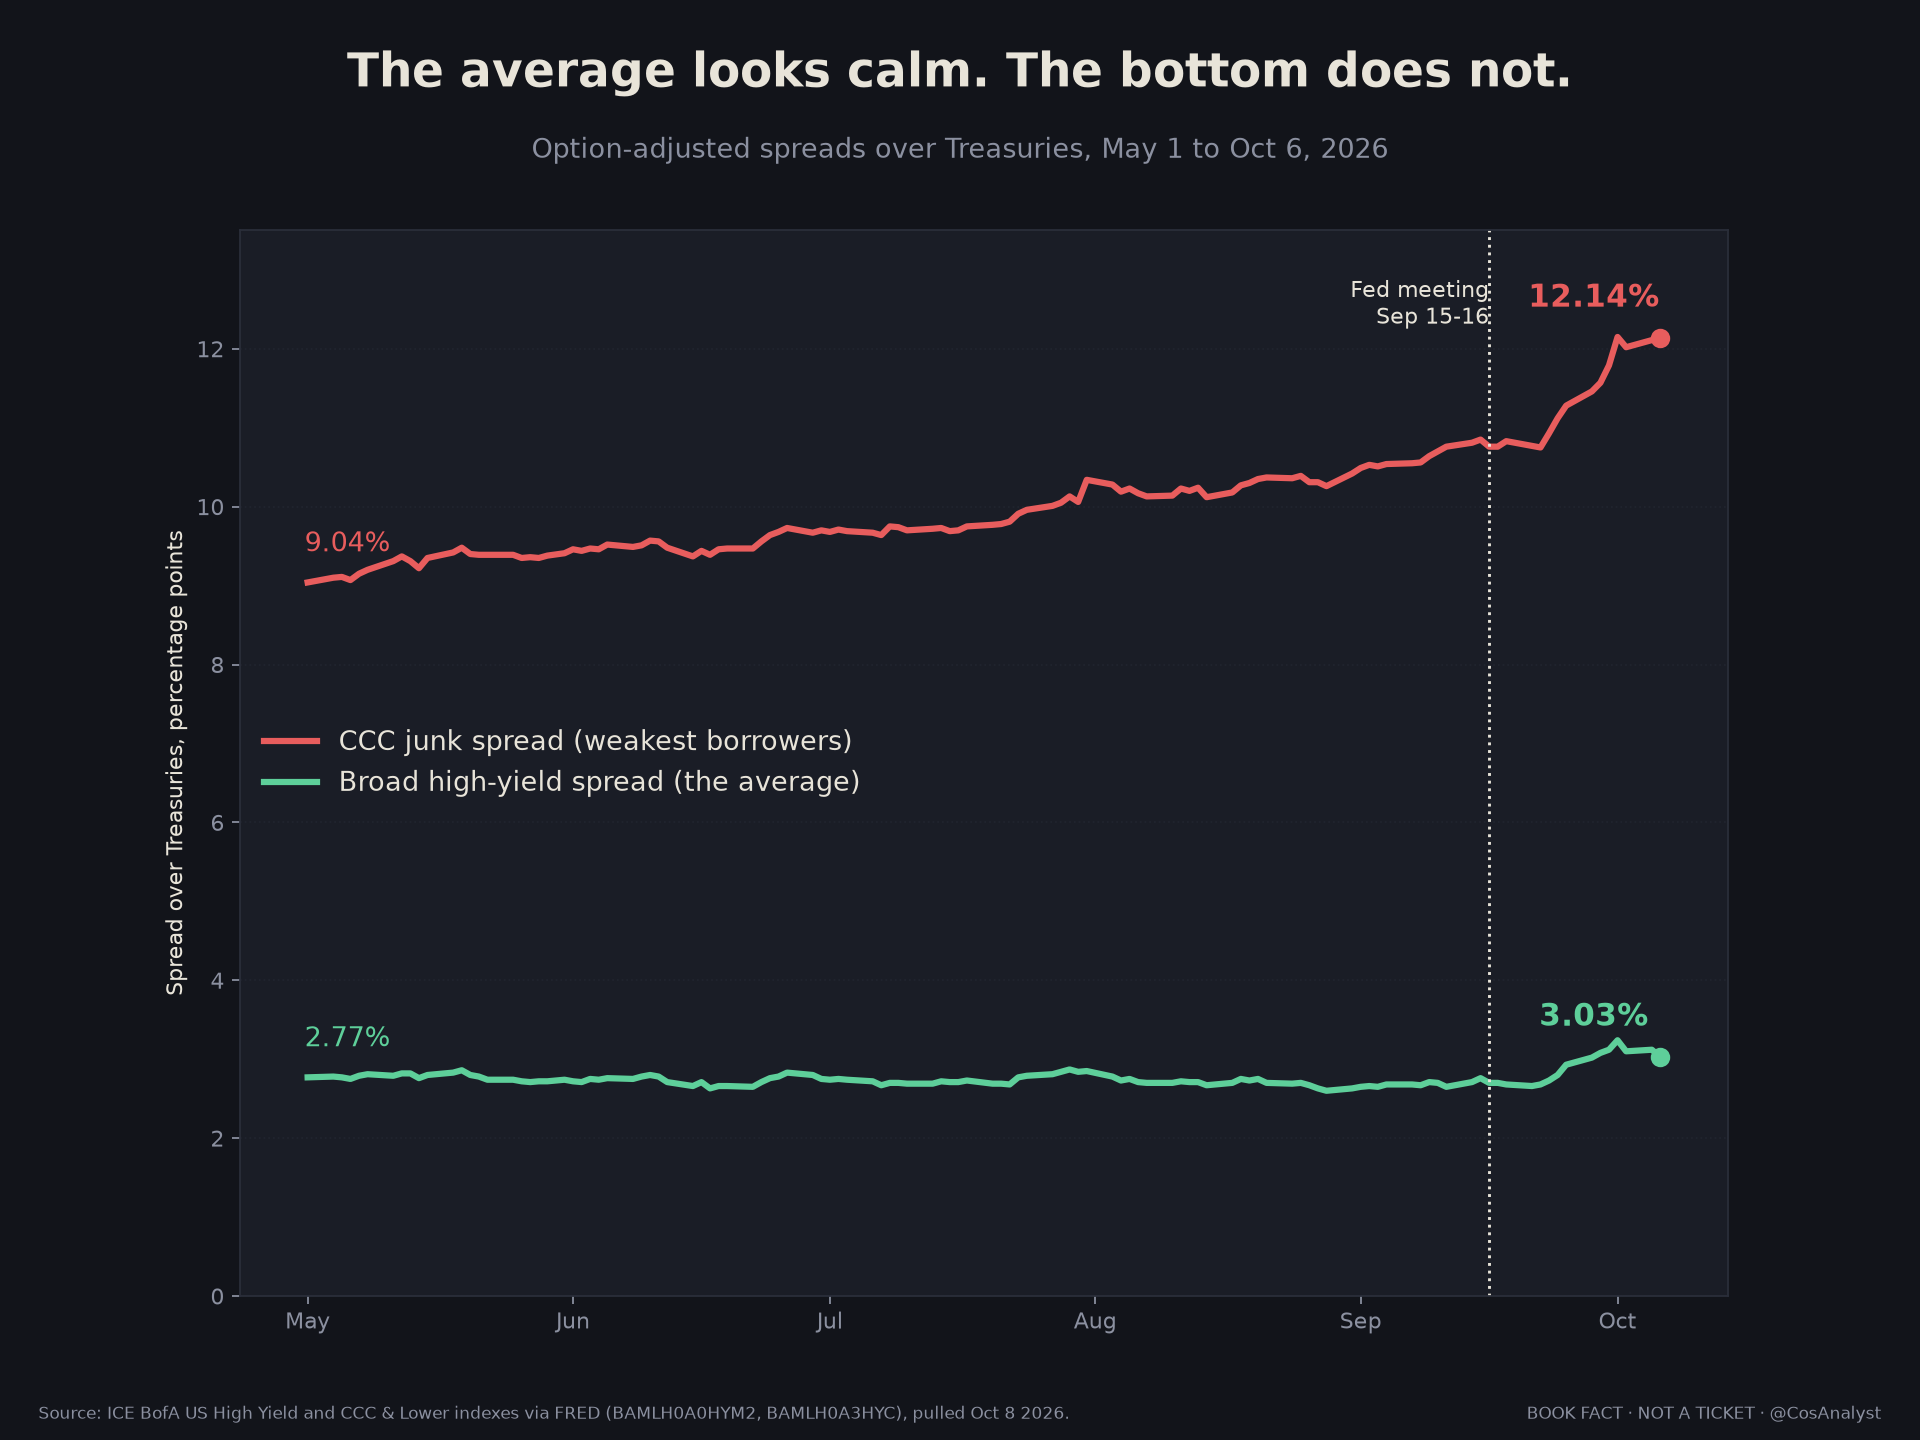
- 1. The weakest borrowers are paying up. CCC bonds are the bottom rung of corporate credit. Their spread over Treasuries was 12.14% on Oct 6. It was 10.76% on the day of the Fed decision and 9.04% on May 1. The Oct 1 reading, 12.15%, is the widest in the three years of data FRED publishes.
- 2. The average is hiding it. The broad high-yield spread is 3.03%, near the low end of its three-year range of 2.59% to 4.61%. That's the market the Fed's "spreads remained narrow" line describes. The gap between the bottom and the average is now about 9.1 points. On May 1 it was about 6.3.
- 3. Mortgages crossed 7%. Freddie Mac's 30-year rate hit 7.28% on Oct 1, the highest since November 2023. In late August it was 6.65%. The minutes already called conditions "somewhat restrictive" for mortgage borrowers and small businesses.
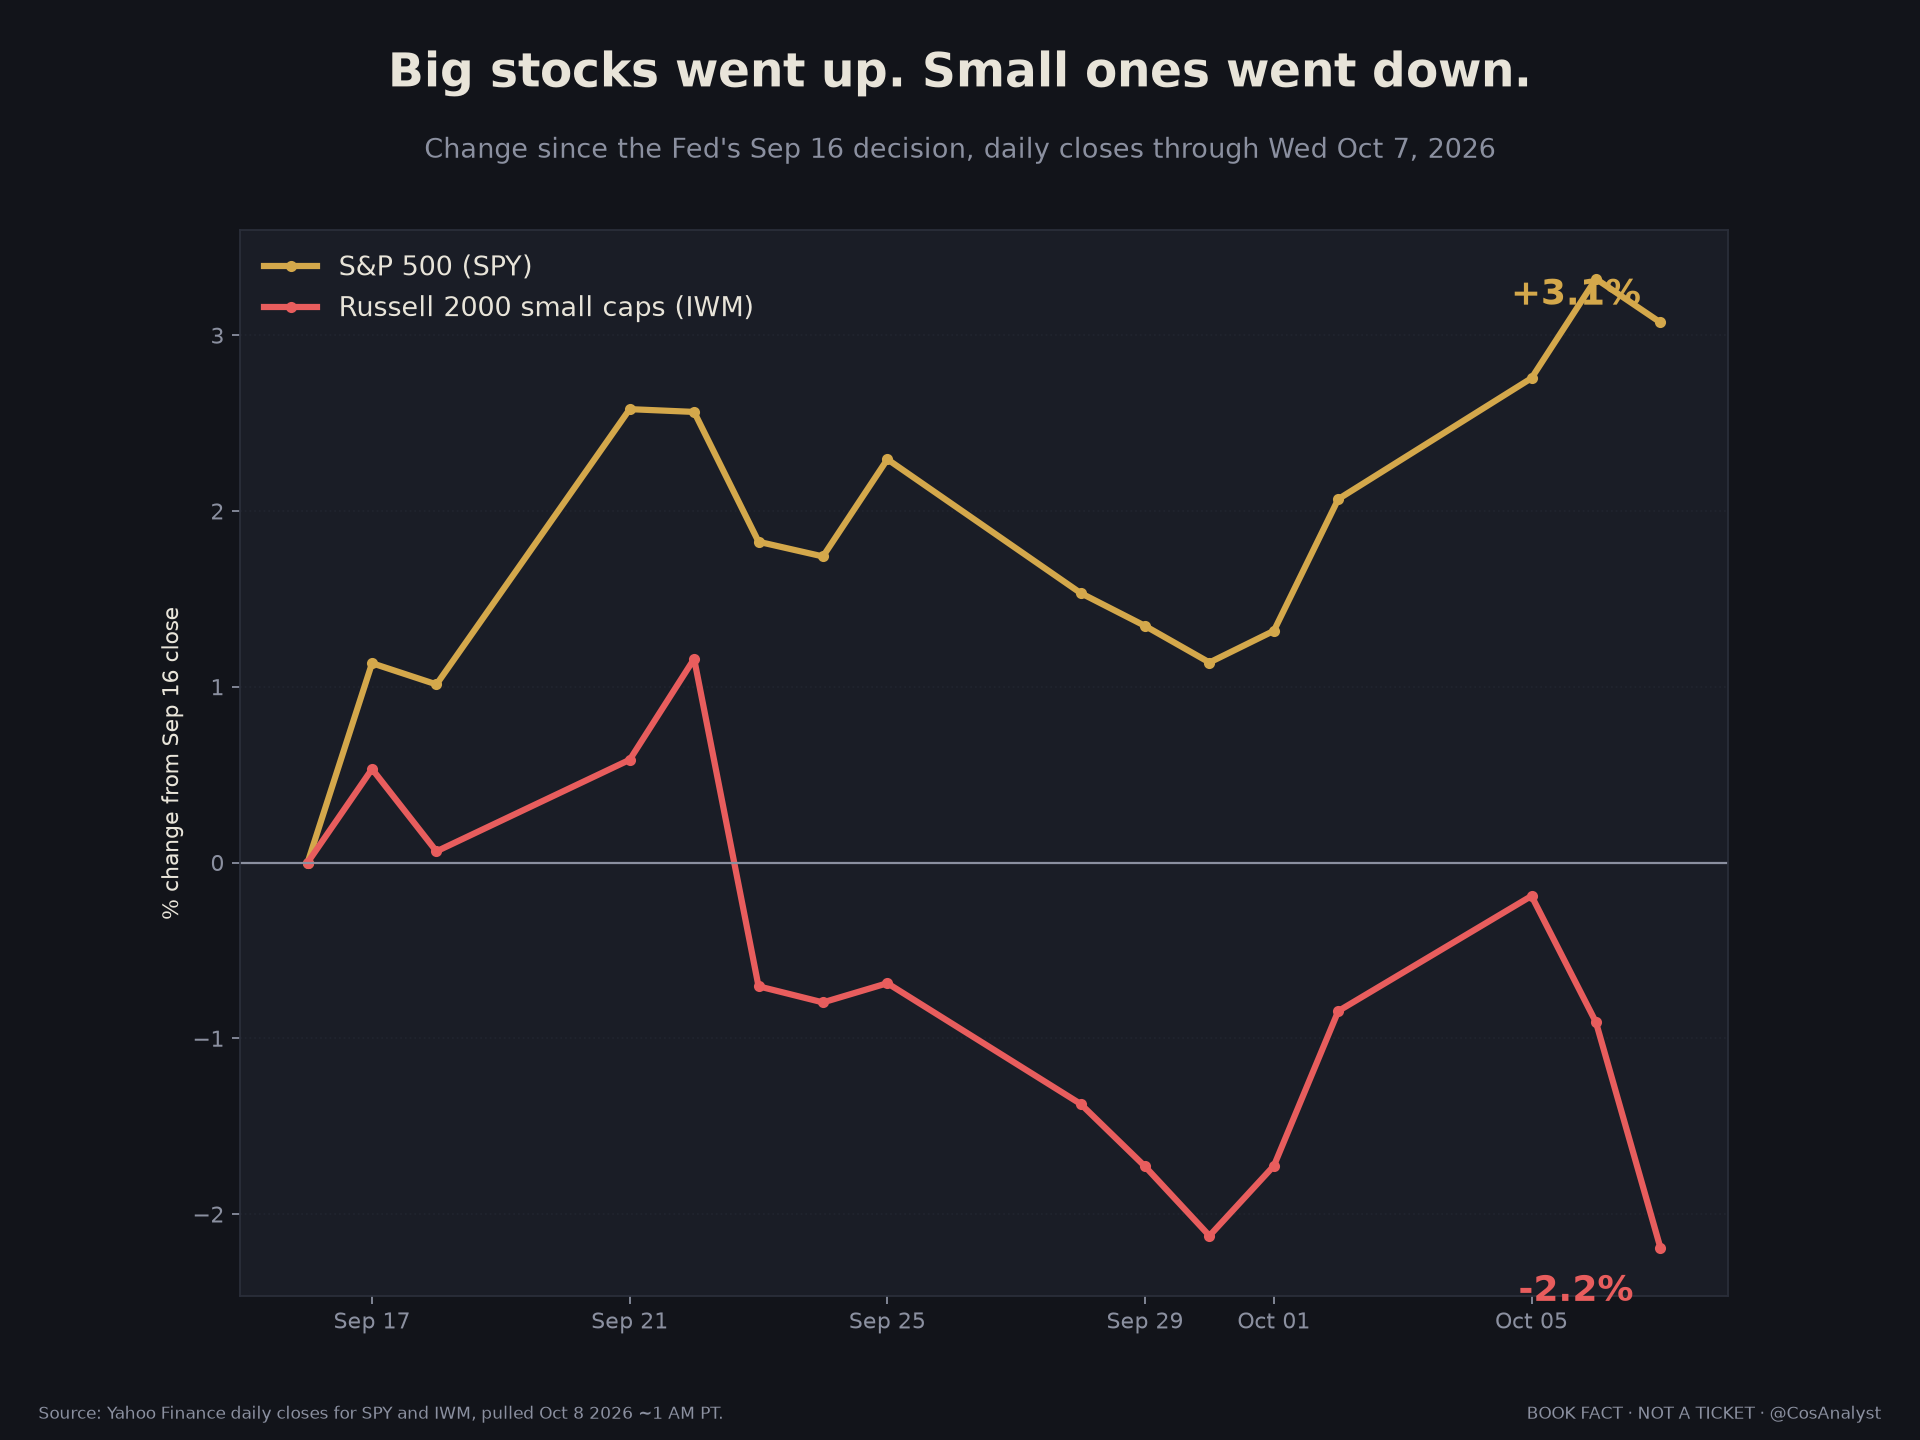
- 4. Small caps are going the other way. Since the Sep 16 close, the S&P 500 (SPY) is up 3.1%. The Russell 2000 (IWM) is down 2.2%. Smaller companies tend to lean harder on borrowed money, so they usually feel high yields first. Russell futures slipped about another 0.9% overnight.
- 5. The jobs data stopped agreeing with the Fed. The minutes said the labor market "had strengthened a bit." Two weeks after that meeting, September payrolls came in at +29,000 against 90,000 expected. Unemployment rose to 4.2%. Yearly wage growth slowed to 3.0%.
What isn't breaking yet
To be fair to the Fed, not everything is flashing. Credit card delinquencies fell to 2.85% in the second quarter, down from 3.05% at the start of 2025. The VIX is around 15.6. The broad junk market is calm. Stress at the bottom is where these stories start. It isn't the whole story yet.
The pattern we've seen before
The last time the 10-year lived up here was 2007. It peaked at 5.26% on June 12 that year, a touch below today. The Fed held its target at 5.25% all summer.
The damage showed up at the bottom of the credit ladder first, in subprime mortgages. Two Bear Stearns hedge funds tied to that market collapsed that summer. In August, BNP Paribas froze three funds it said it could no longer value. The Fed cut half a point on Sept. 18, 2007, to 4.75%. The S&P 500 still made its final high that October.
One precedent isn't a forecast. In October 2023 the 10-year hit 4.98% and mortgages hit 7.79%, and the economy kept growing. What 2007 teaches is the order of events. High rates break whatever depends on cheap money. Spreads widen at the bottom first. The average catches up later. The Fed reacts last.
What we're watching, and the plan
- 1. 5.29% on the 10-year. Above it, the pressure on weak borrowers stays on. A close back under 5.24% would be the first real relief.
- 2. 12.15% on CCC spreads. That's the three-year wide. A clean break above it says the stress is spreading. If the broad high-yield spread also pushes past 3.5%, that's our line for when the problem has reached the middle of the market.
- 3. $279 on IWM. Small caps reclaiming Wednesday's high would say the selling was nerves. Failing there while yields sit still points back at credit.
- 4. Jobless claims today at 5:30 AM PT. The forecast is 200,000. Last week was 197,000. A jump would back up the weak payroll print. CPI follows on Oct 14.
- 5. Your own exposure. Count how much of what you own depends on cheap money: small caps, high-yield bonds, companies that aren't profitable yet. Size it so a bad month can't turn into a bad year.
The takeaway
You don't have to call the top to protect yourself. You have to notice when the bottom of the credit ladder stops agreeing with the top. Right now it doesn't. The Fed is reading the average. We're watching the bottom, and we'll keep checking it here.
BOOK FACT · NOT A TICKET. CosAnalyst research. Not financial advice. Levels are watch lines, not orders. Probabilities and prices move.
Sources / as-of
- federalreserve.gov (FOMC minutes, Sep 15-16, 2026)
- fred.stlouisfed.org (ICE BofA CCC & Lower spread)
- fred.stlouisfed.org (ICE BofA US High Yield spread)
- fred.stlouisfed.org (10-year Treasury, DGS10)
- fred.stlouisfed.org (Freddie Mac 30-year mortgage)
- fred.stlouisfed.org (credit card delinquency rate)
- polymarket.com (Fed decision in December)
- Payrolls, claims and CPI dates: BLS and DOL via TradingView economic calendar. Prices: Yahoo Finance (SPY, IWM, DXY, Russell futures, VIX), pulled about 1 AM PT Oct 8. Fed target history: FRED DFEDTAR.